
Alternative data
Alternative KPIs used to track the performance of protocols
Active users (daily)
What is this metric: Unique addresses that use the protocol's service on a daily basis.
How it is calculated: Number of unique addresses interacting with the protocol's business relevant smart contracts, sourced from onchain data.
Why do we show it: Important to know if there are 3 vs. 300k users, gives a better understanding of the protocol’s traction.
Example:
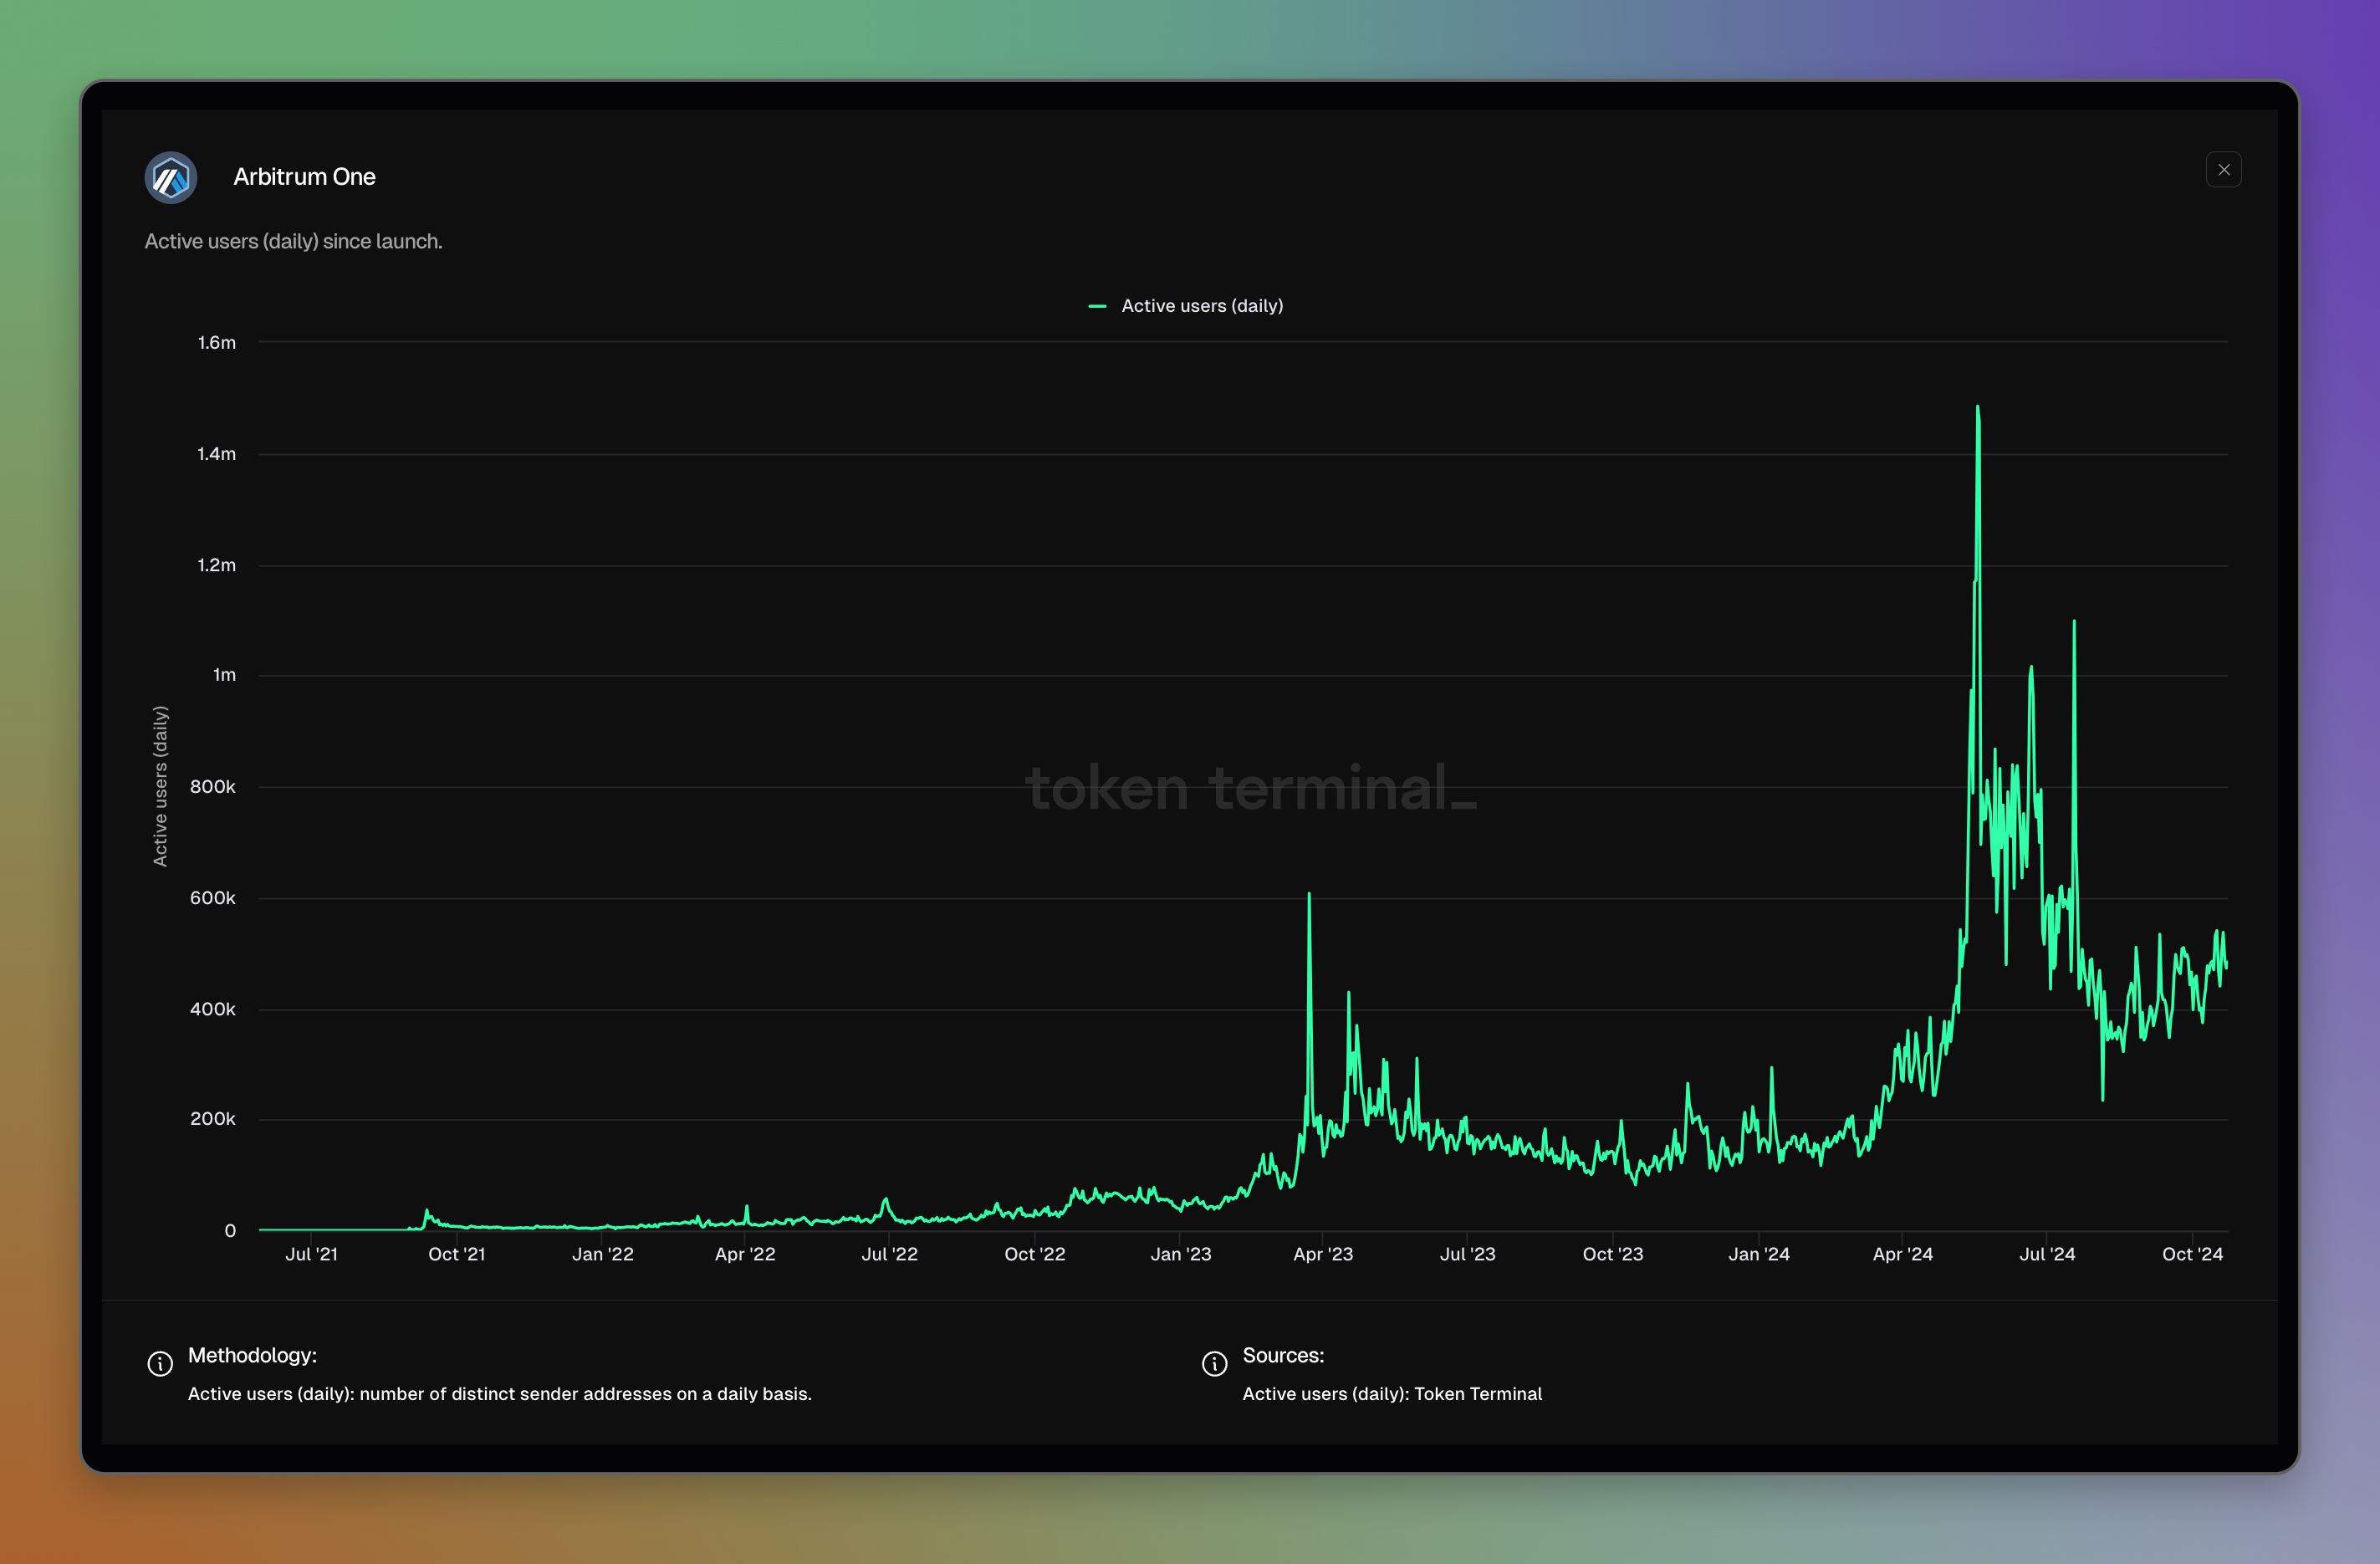
Arbitrum dashboard: https://tokenterminal.com/terminal/projects/arbitrum
Active users (weekly)
What is this metric: Unique addresses that use the protocol's service on a weekly basis, based on a 7-day rolling window.
How it is calculated: Number of unique addresses interacting with the protocol's business relevant smart contracts, sourced from onchain data.
Why do we show it: Important to know if there are 3 vs. 300k users, gives a better understanding of the protocol’s traction.
Example:
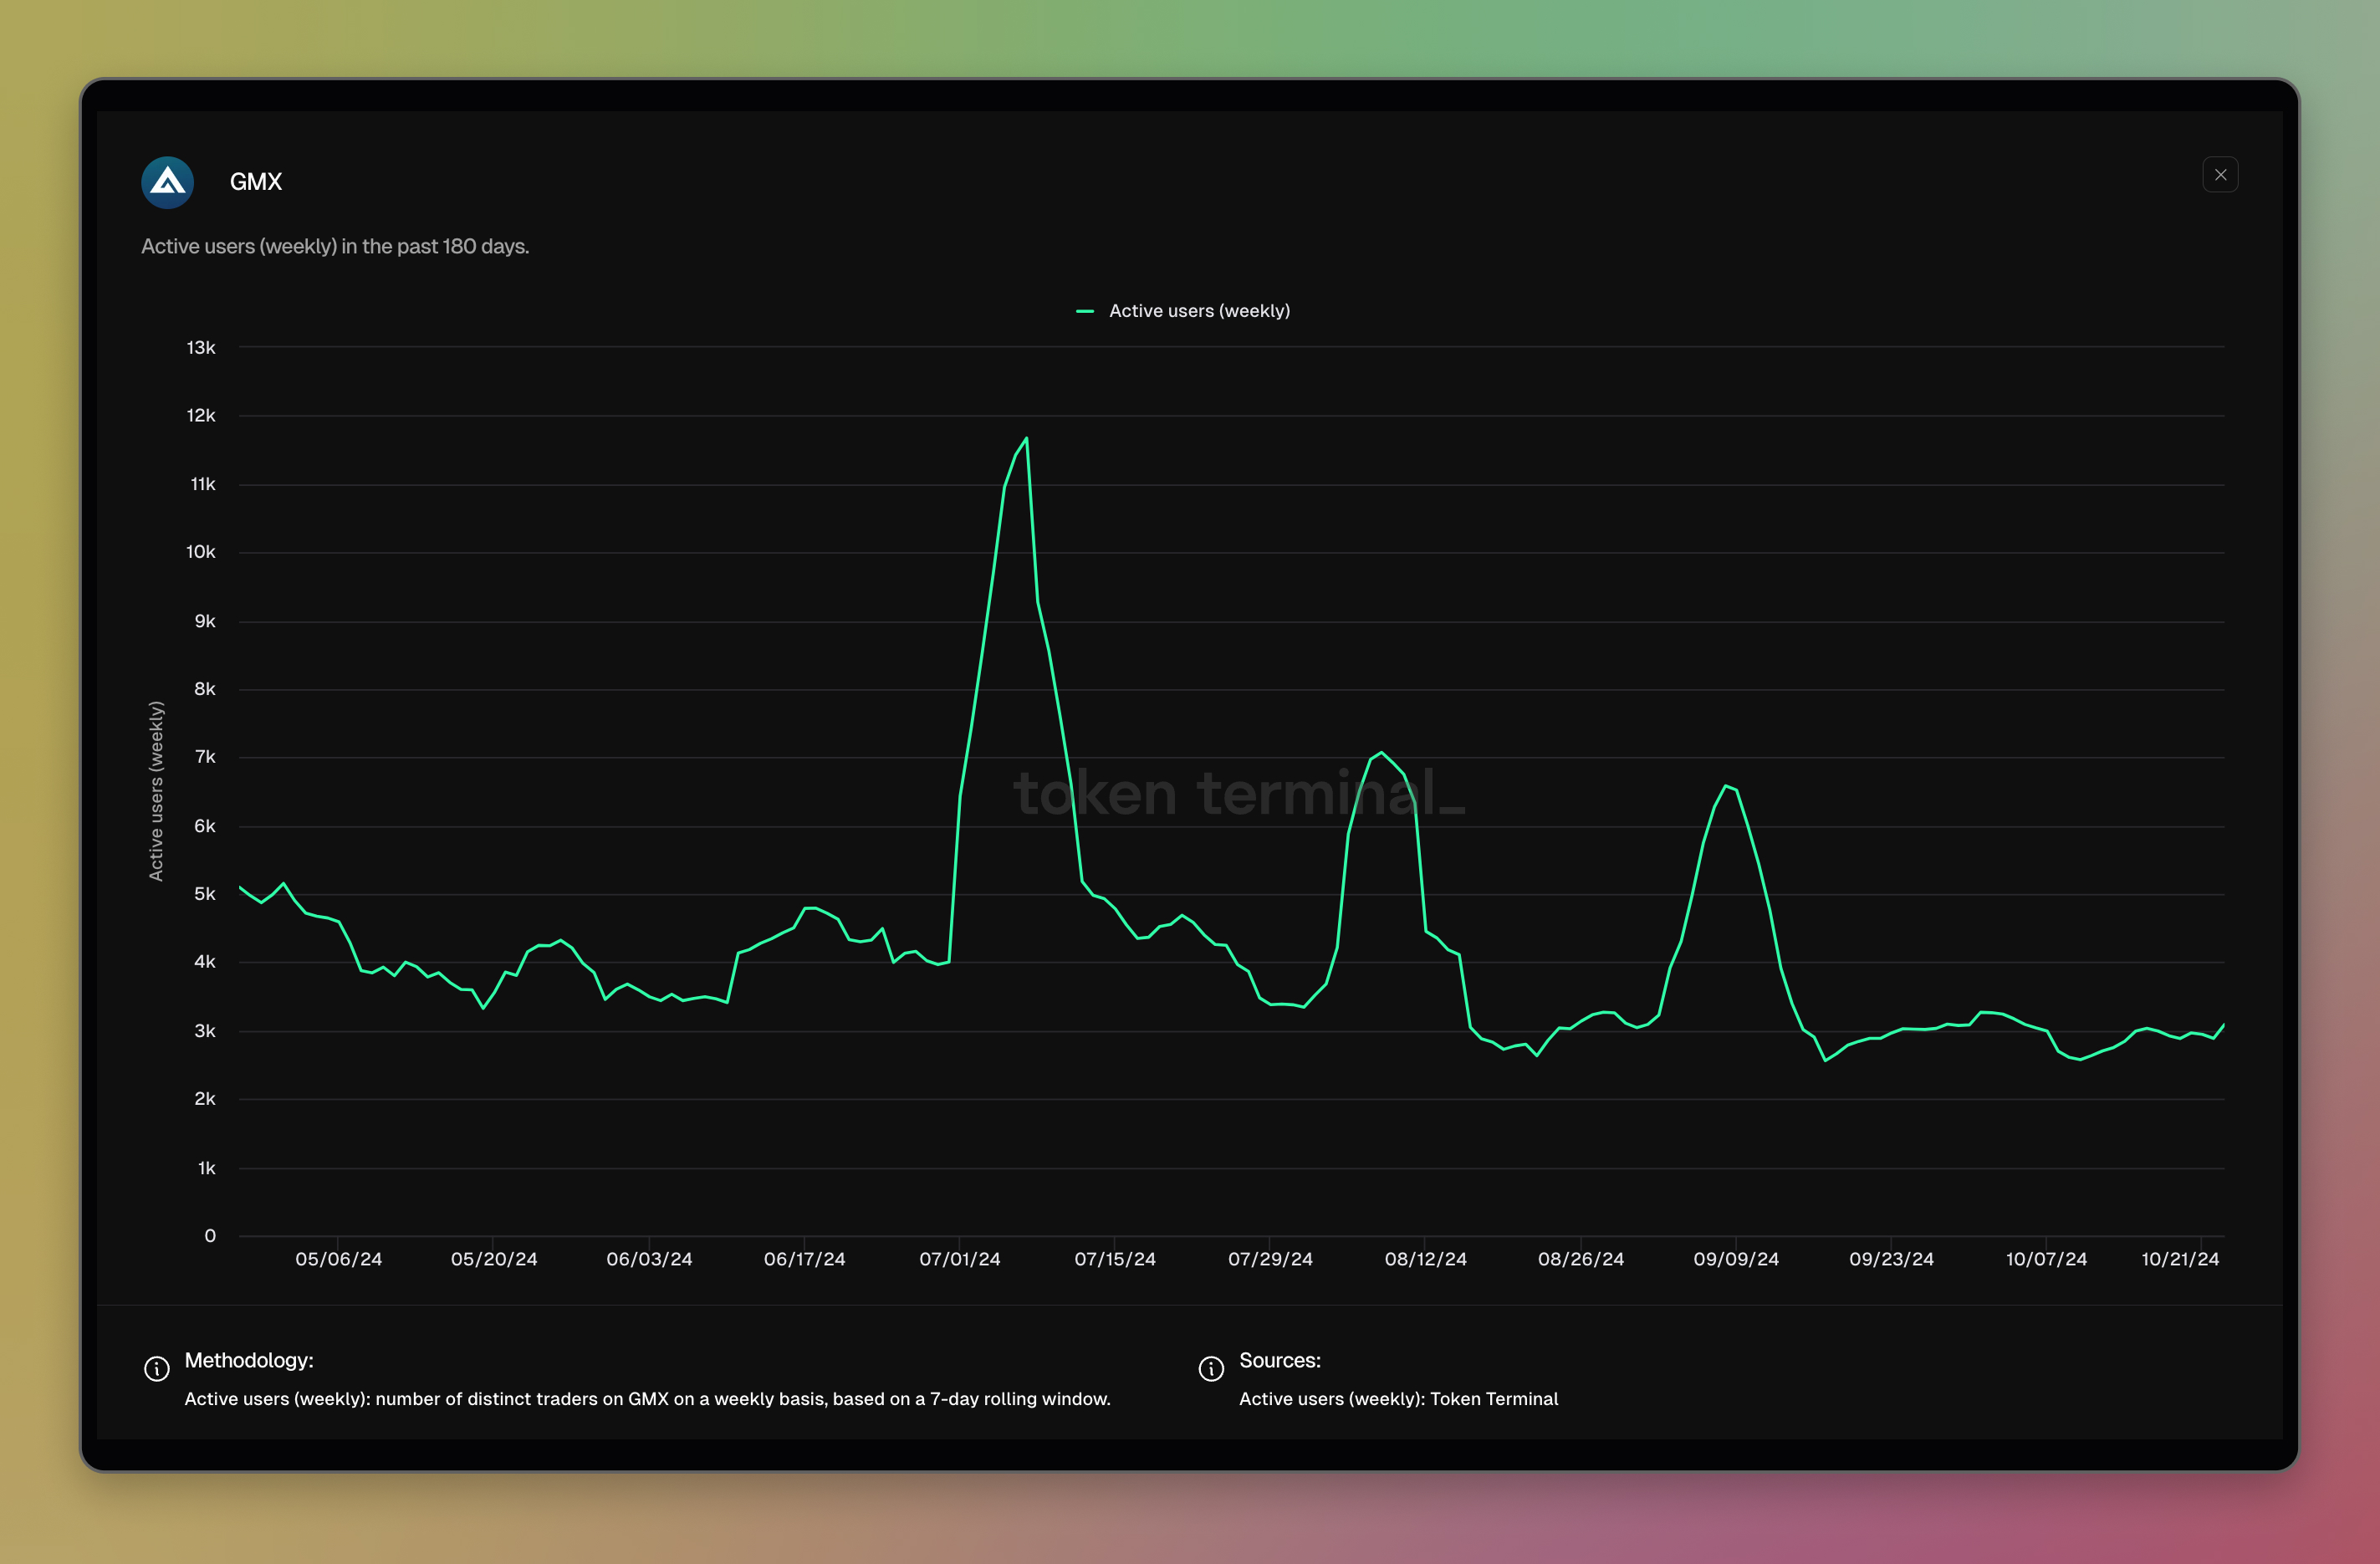
GMX dashboard: https://tokenterminal.com/terminal/projects/gmx
Active users (monthly)
What is this metric: Unique addresses that use the protocol's service on a monthly basis, based on a 30-day rolling window.
How it is calculated: Number of unique addresses interacting with the protocol's business relevant smart contracts, sourced from onchain data.
Why do we show it: Important to know if there are 3 vs. 300k users, gives a better understanding of the protocol’s traction.
Example:
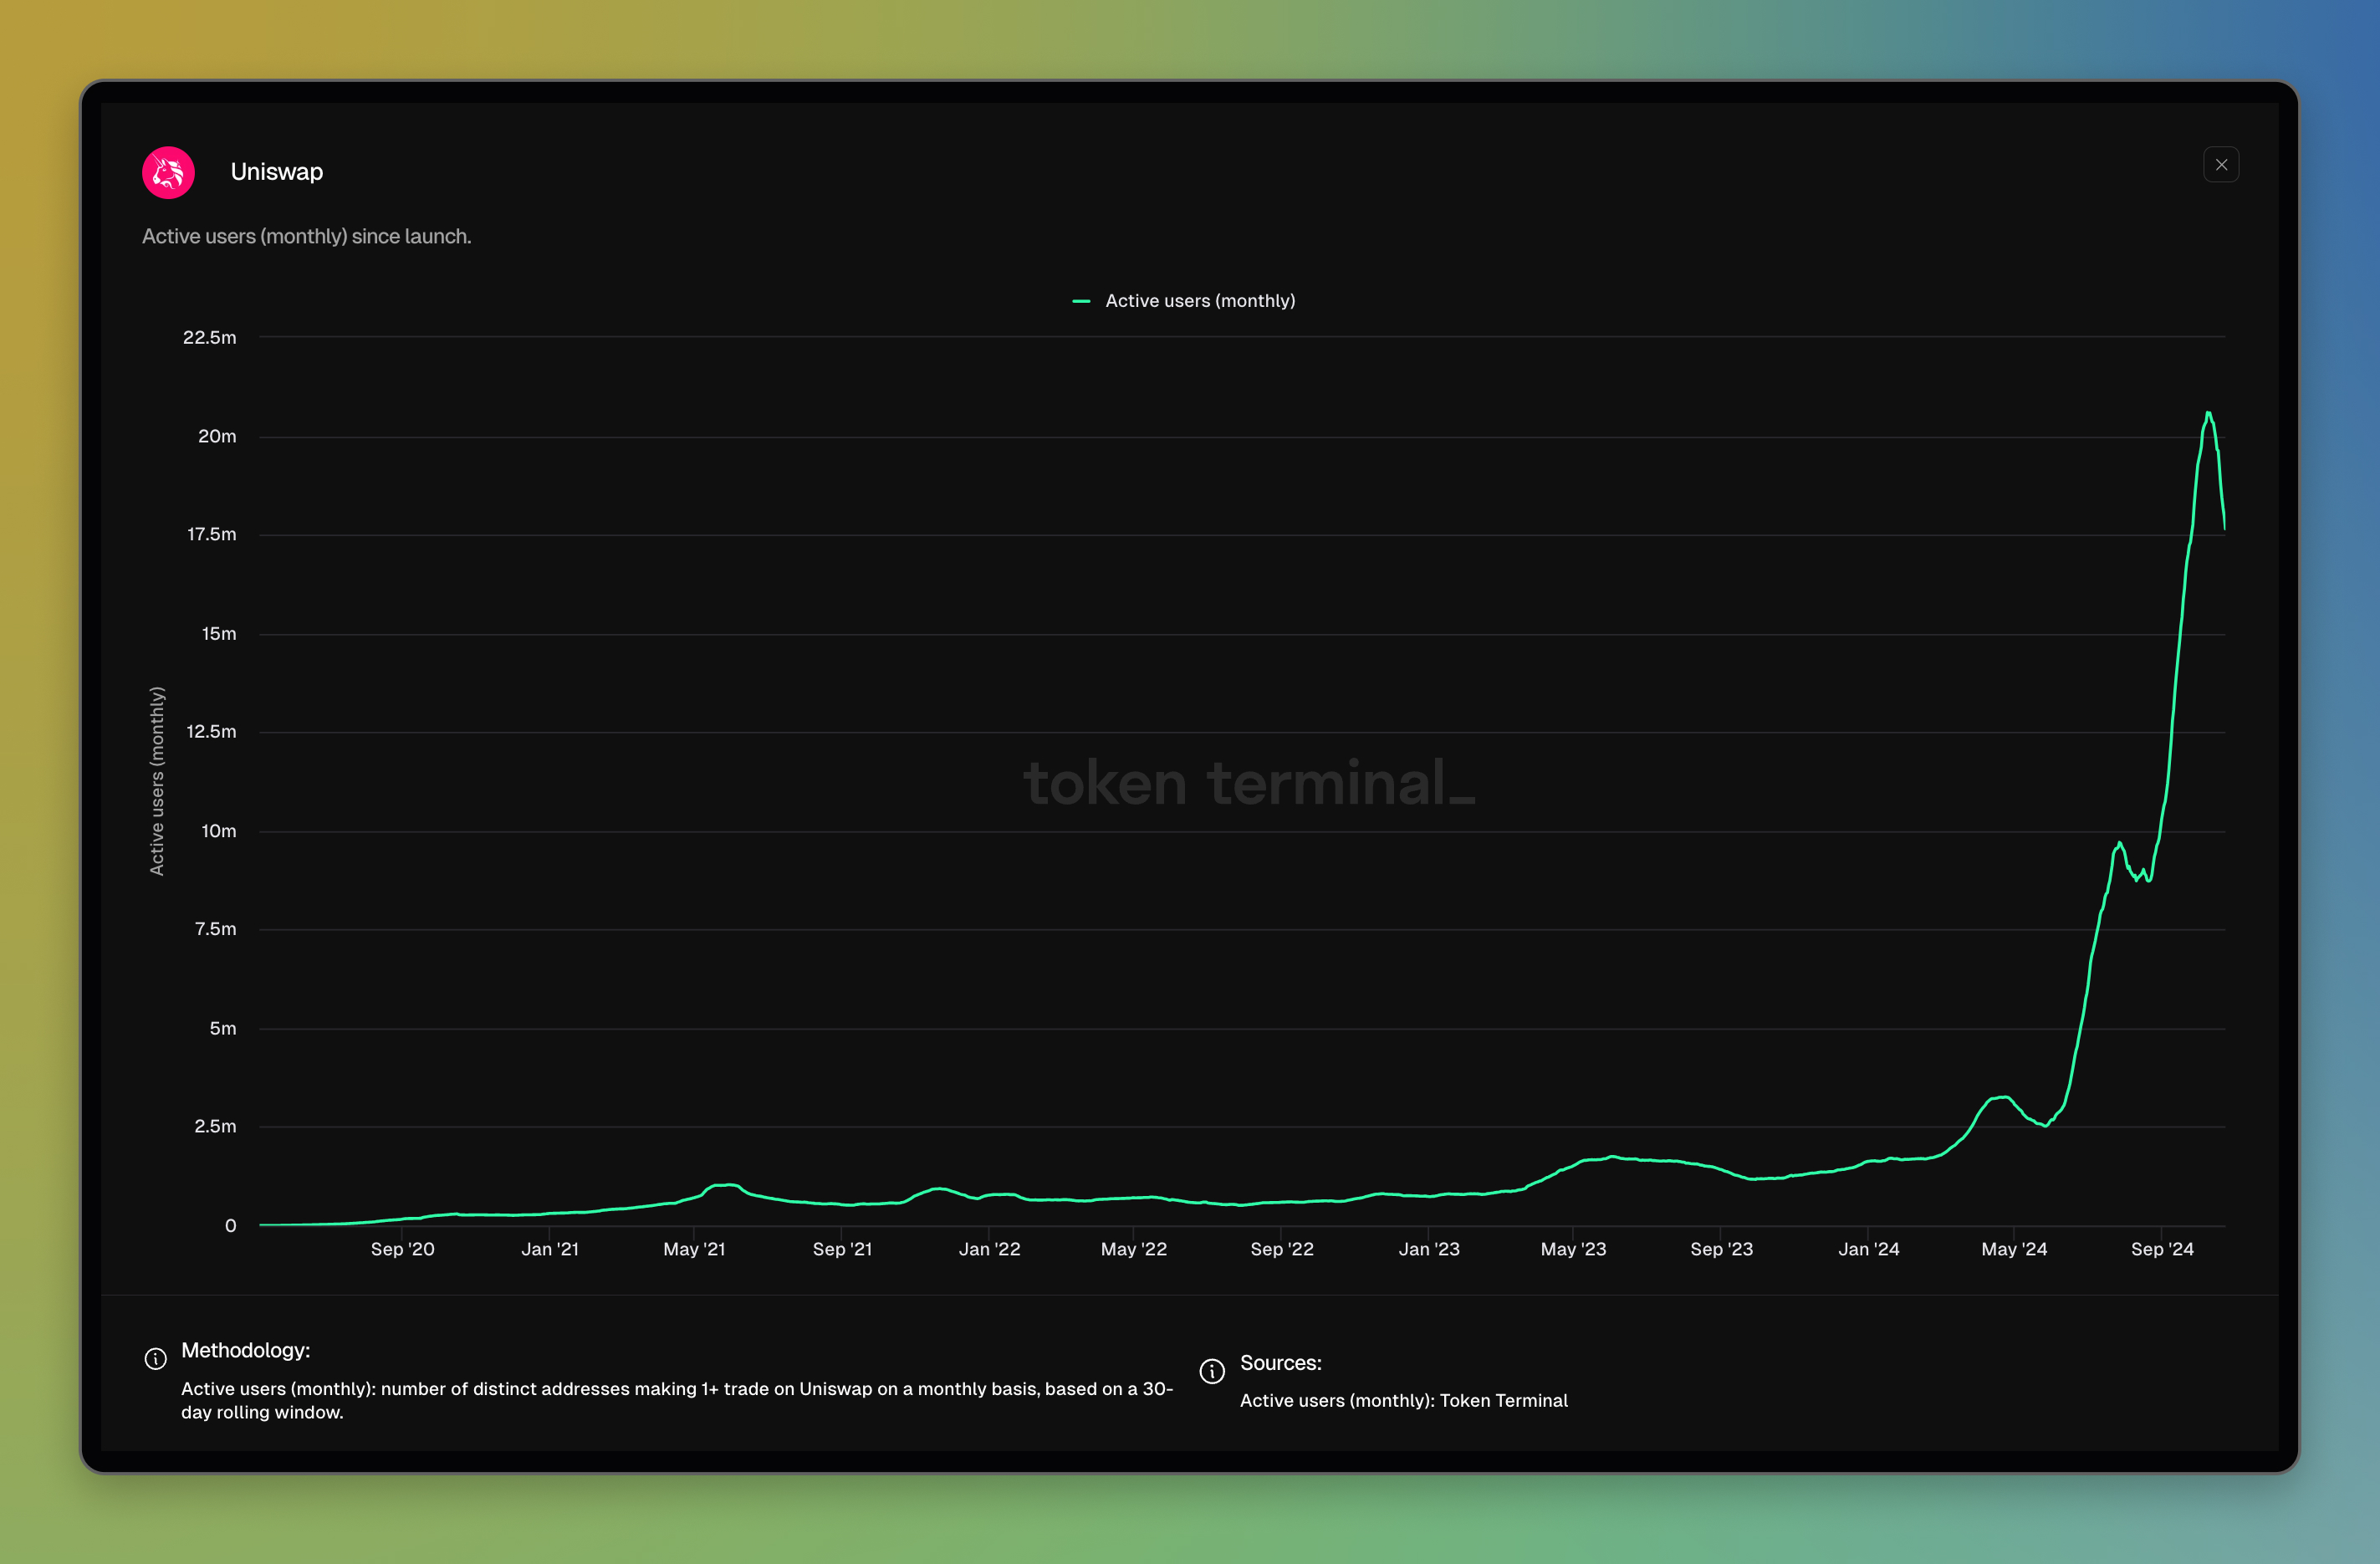
Uniswap dashboard: https://tokenterminal.com/terminal/projects/uniswap
AFPU - Average Fees Per User
What is this metric: AFPU (Average Fees Per User) is a measurement of how much daily fees the average user generates.
How it is calculated: AFPU is calculated as daily fees divided by daily number of users, sourced from onchain data. The definition of 'user' varies depending on the market sector. You can find it on the project-specific dashboard in the 'definition' section.
Why do we show it: The metric works as a proxy for the fees generated by one user. It helps us understand user behavior. High values state high fee contributions relative to the number of users. Low values suggest that most users are generating little fees.
Example:
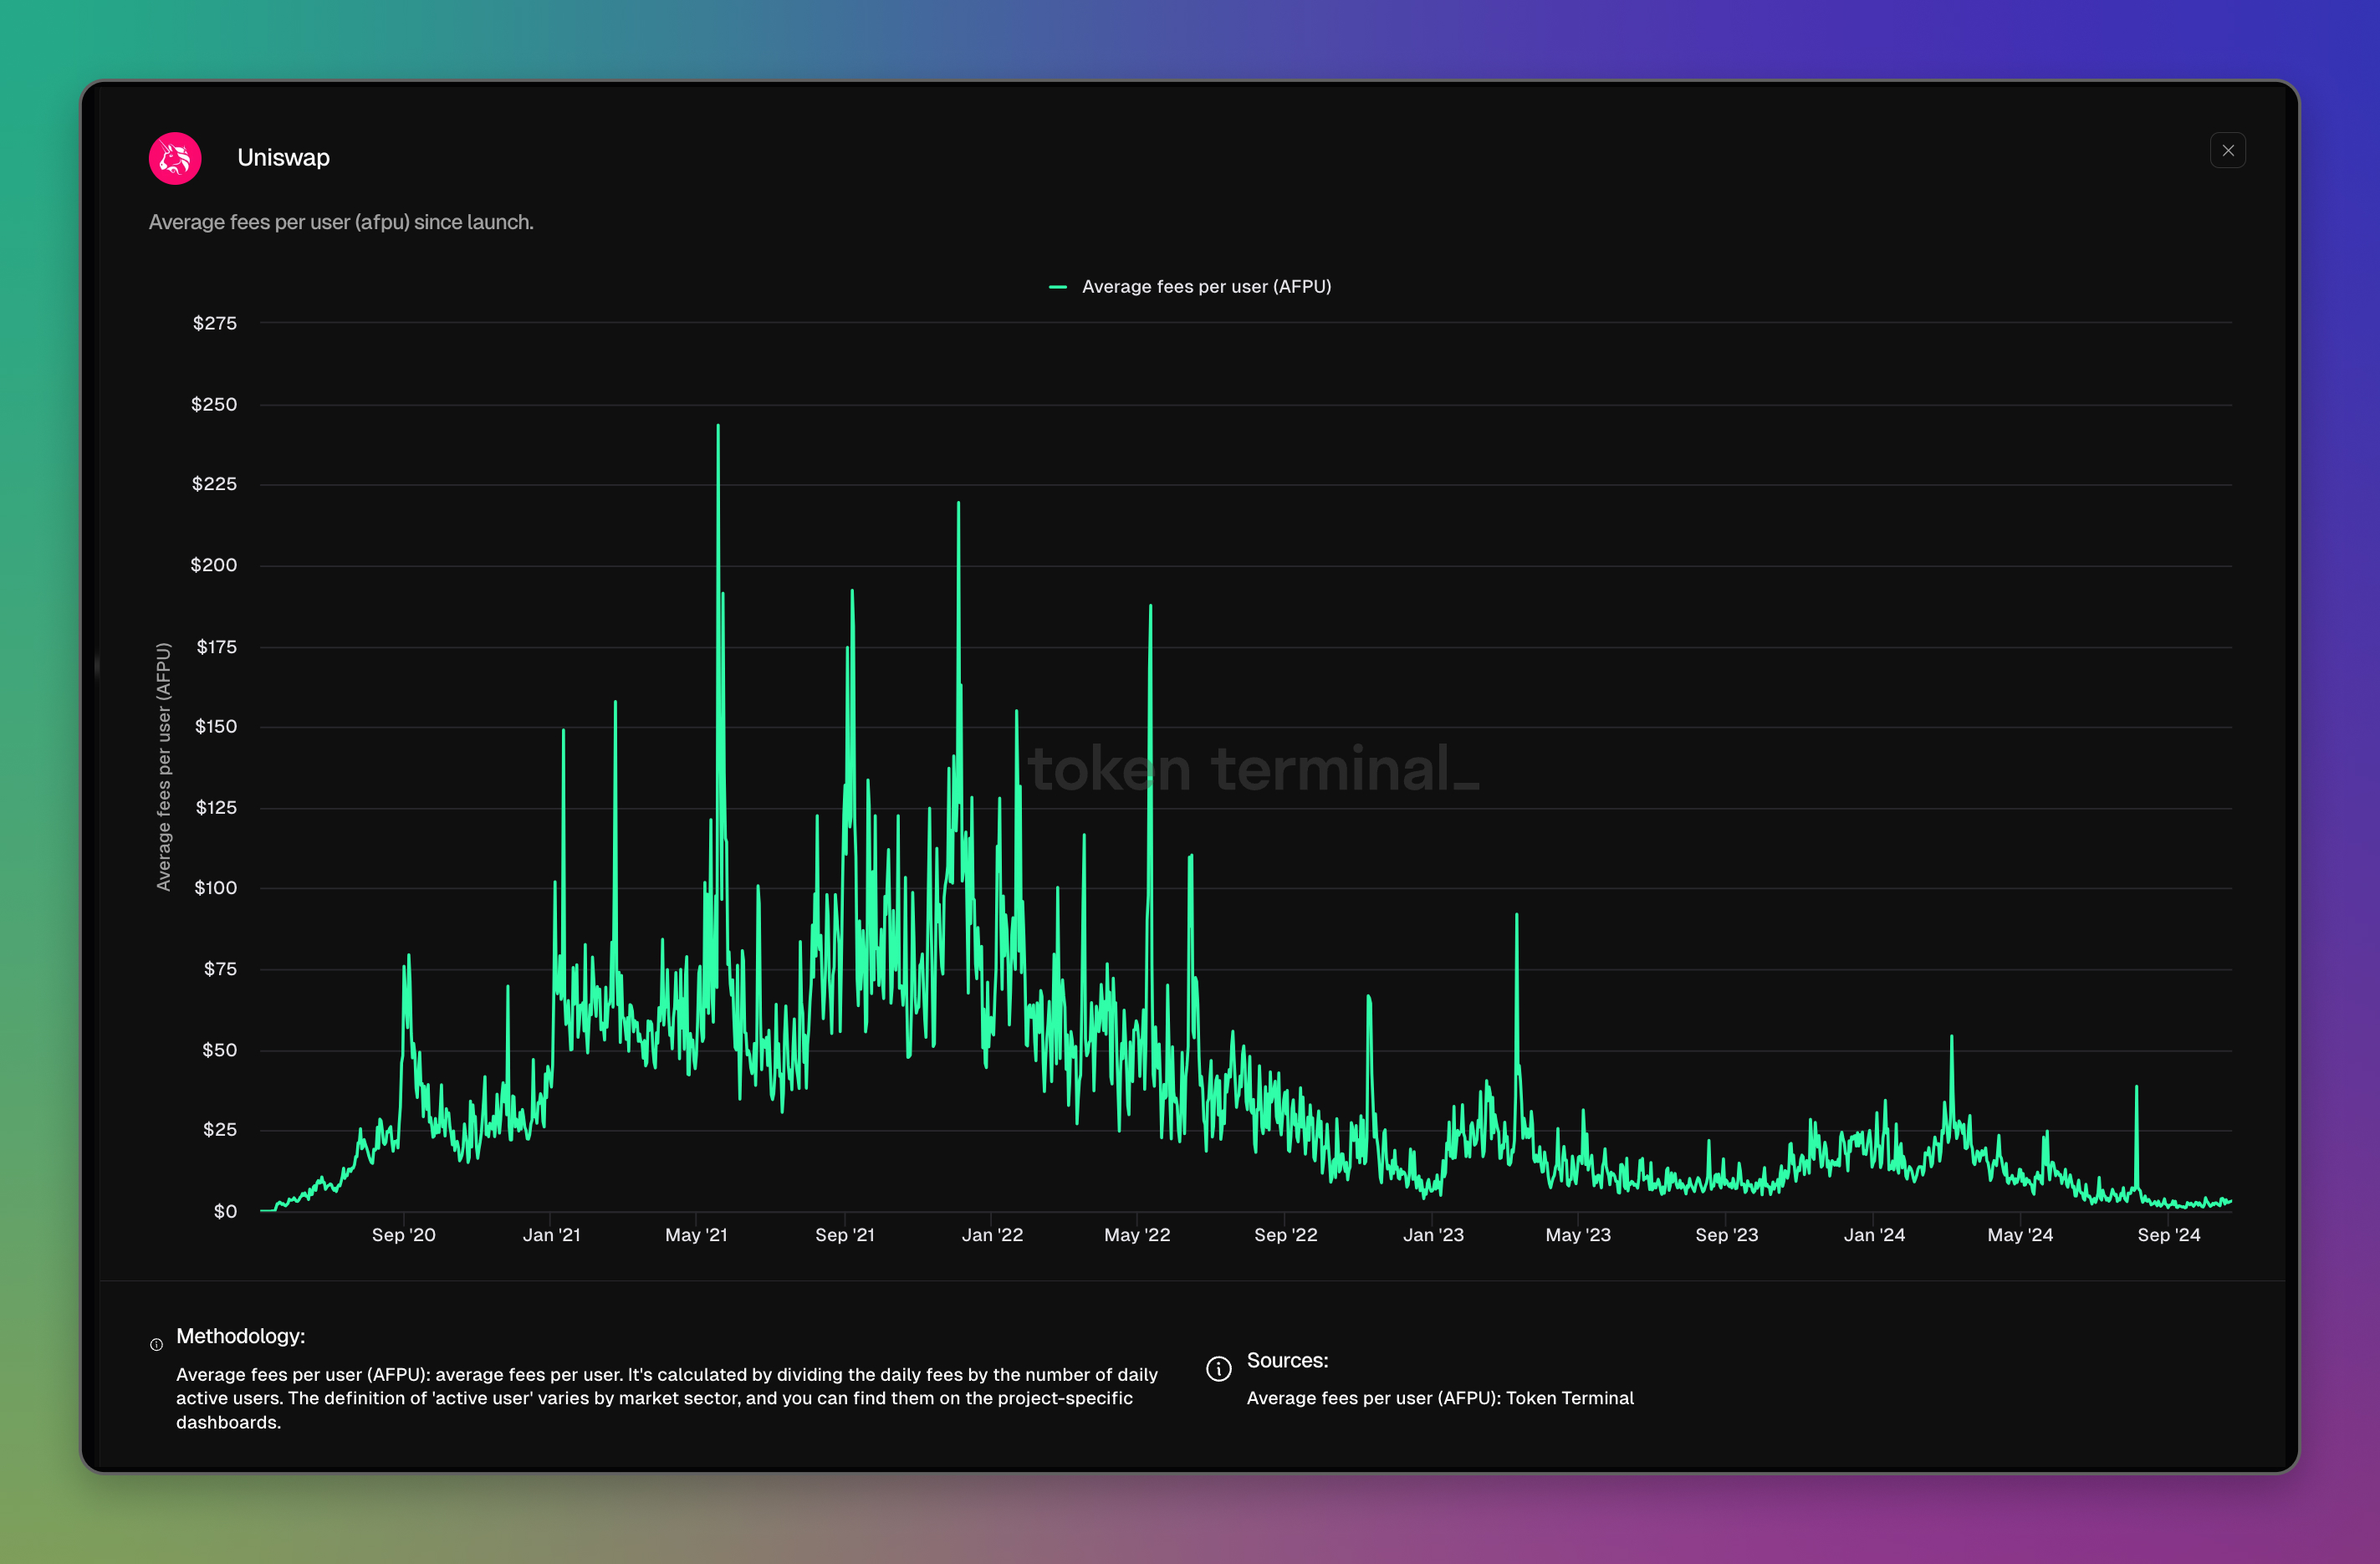
Uniswap dashboard: https://tokenterminal.com/terminal/projects/uniswap
ARPU - Average Revenue Per User
What is this metric: ARPU (Average Revenue Per User) is a measurement of how much daily revenue the average user generates.
How it is calculated: ARPU is calculated as daily revenue divided by number of users, sourced from onchain data. The definition of 'user' varies depending on the market sector. You can find it on the project-specific dashboard in the 'definition' section.
Why do we show it: The metric works as a proxy for the value generated by one user. It helps us understand user behavior. High values state high revenue contributions relative to the number of users. Low values suggest that most users are generating little revenue.
Example:
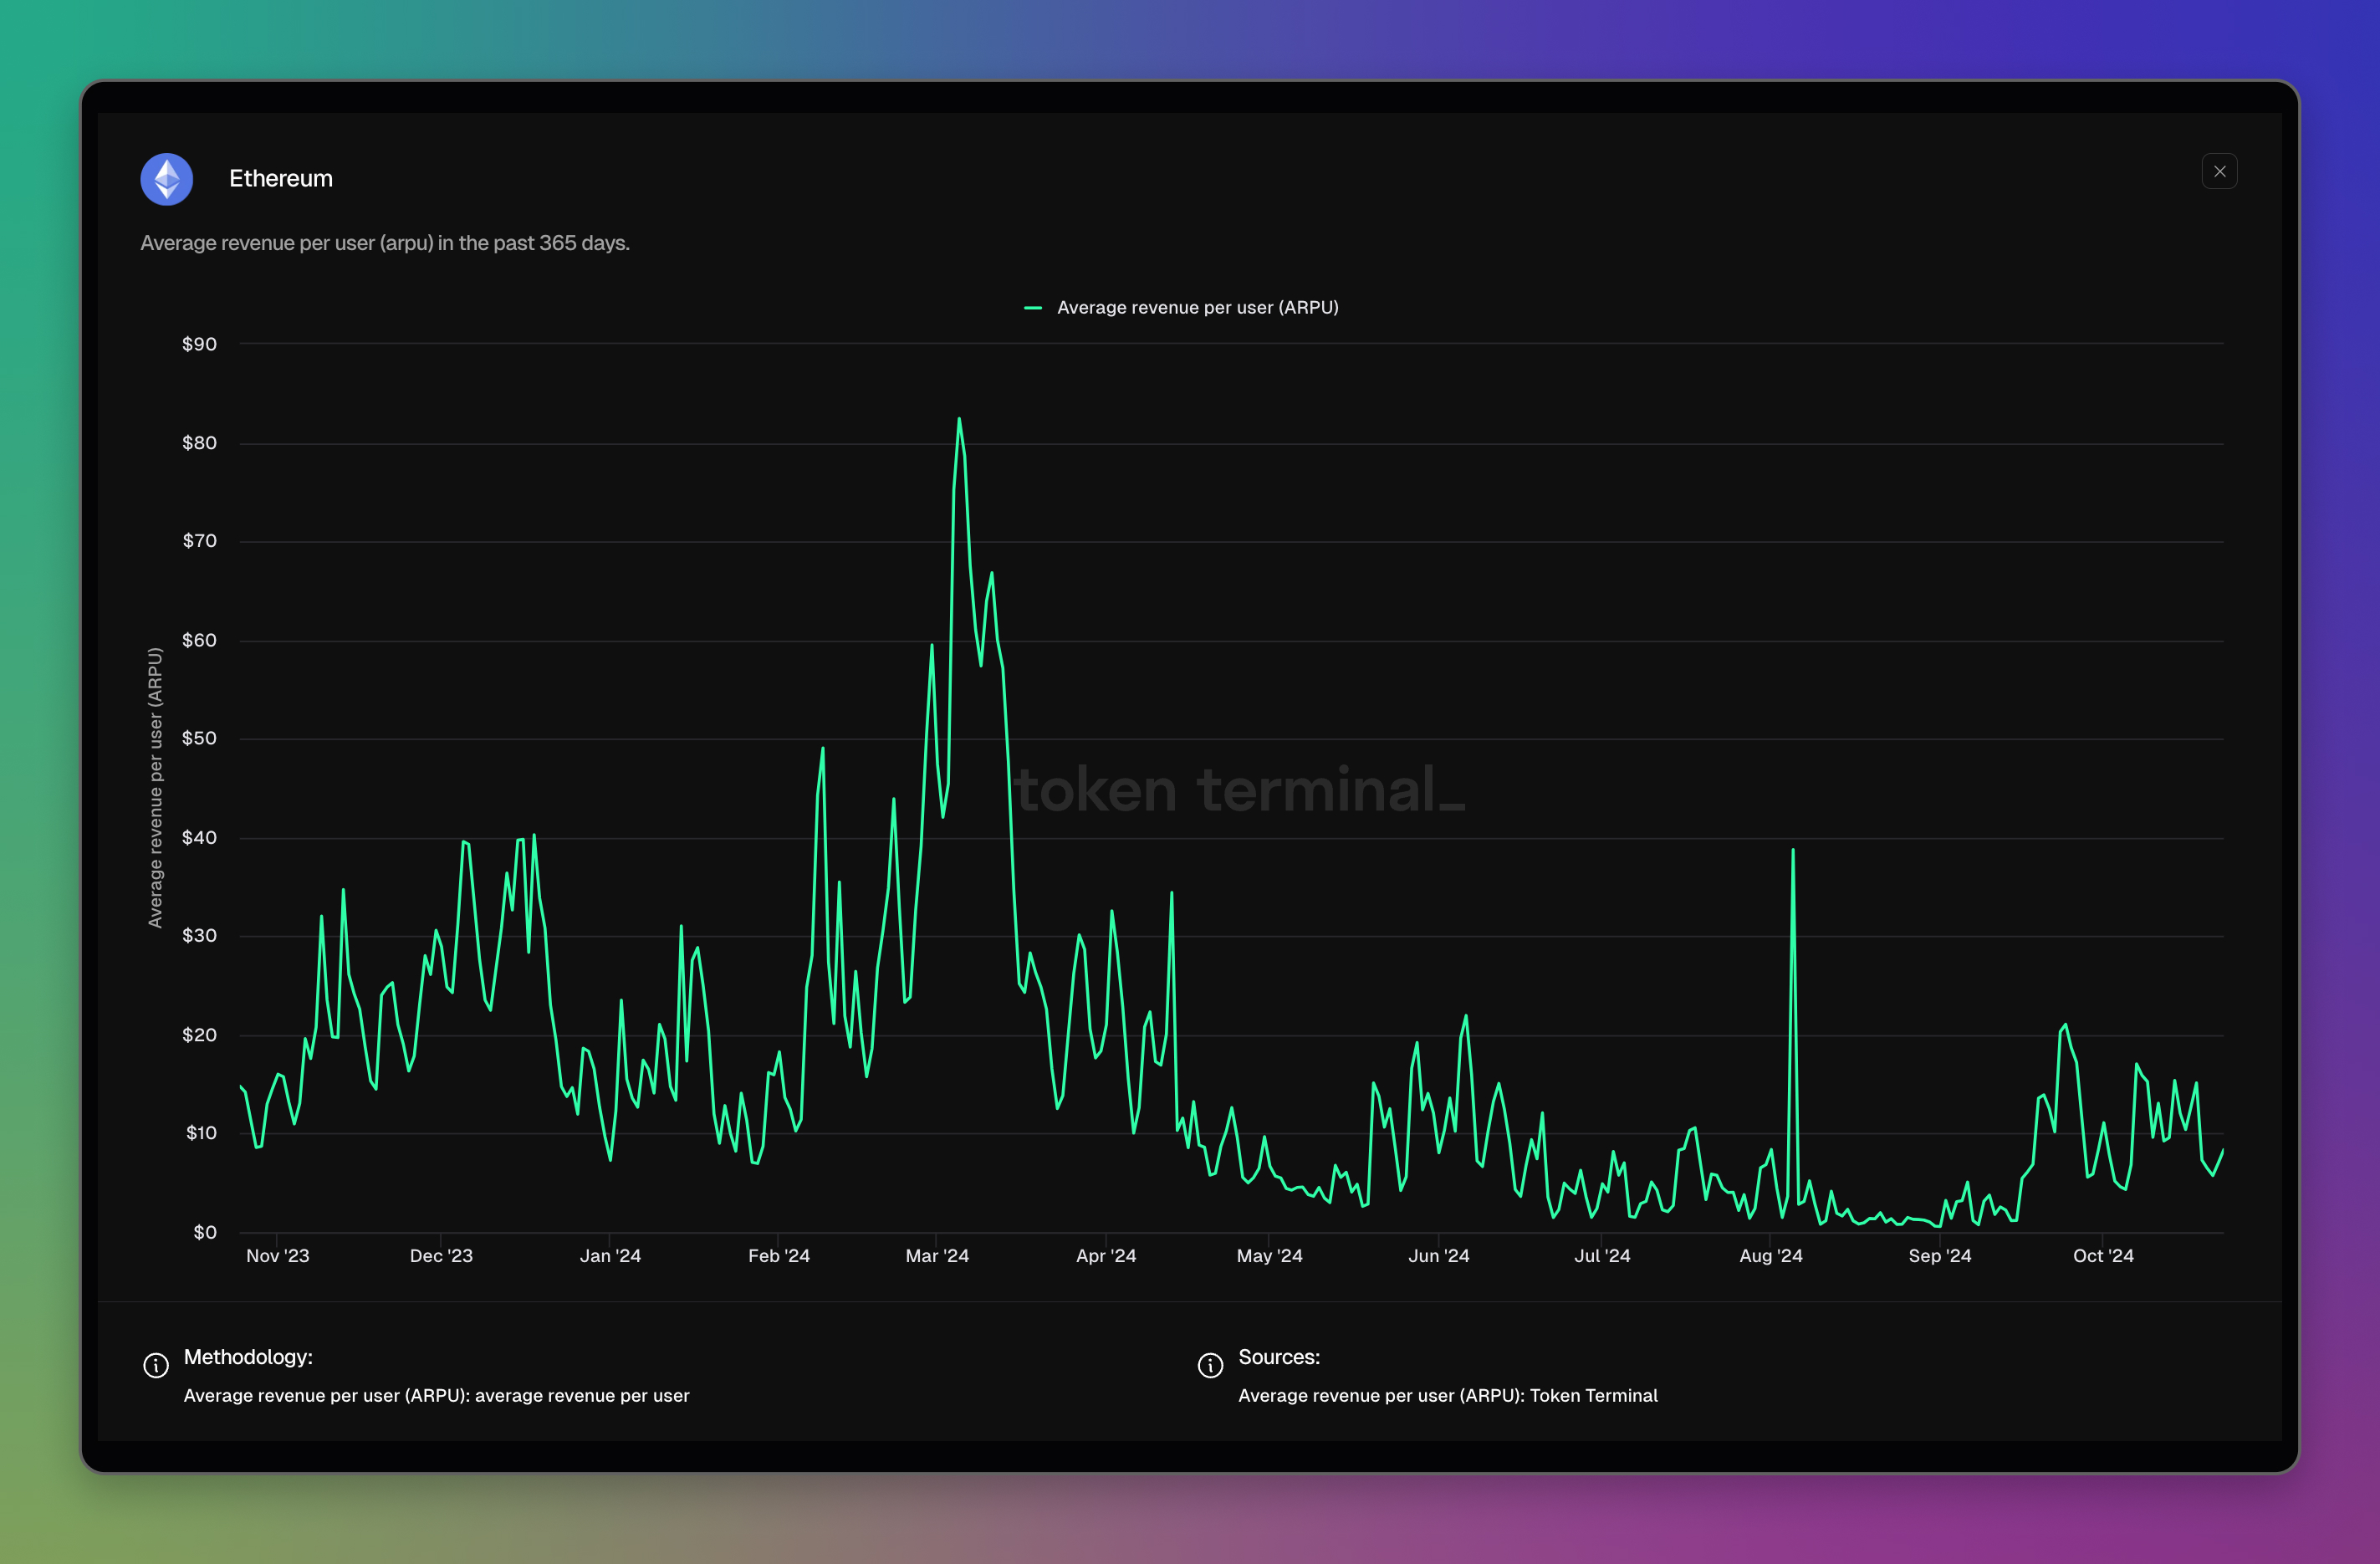
Ethereum dashboard: <https://tokenterminal.com/terminal/projects/ethereum>
Average trading volume (per trade)
What is this metric: Average trading volume (per trade) is a measurement of how much daily trading volume, on average, is generated by one trade.
How it is calculated: Average trading volume (per trade) is calculated as trading volume divided by trade count, sourced from onchain data.
Why do we show it: The metric works as a proxy for how the DEX is used. It helps us understand user behavior. High values indicate high trading volume contributions relative to the number of trades. Low values suggest that most trades are generating little trading volume.
Example:
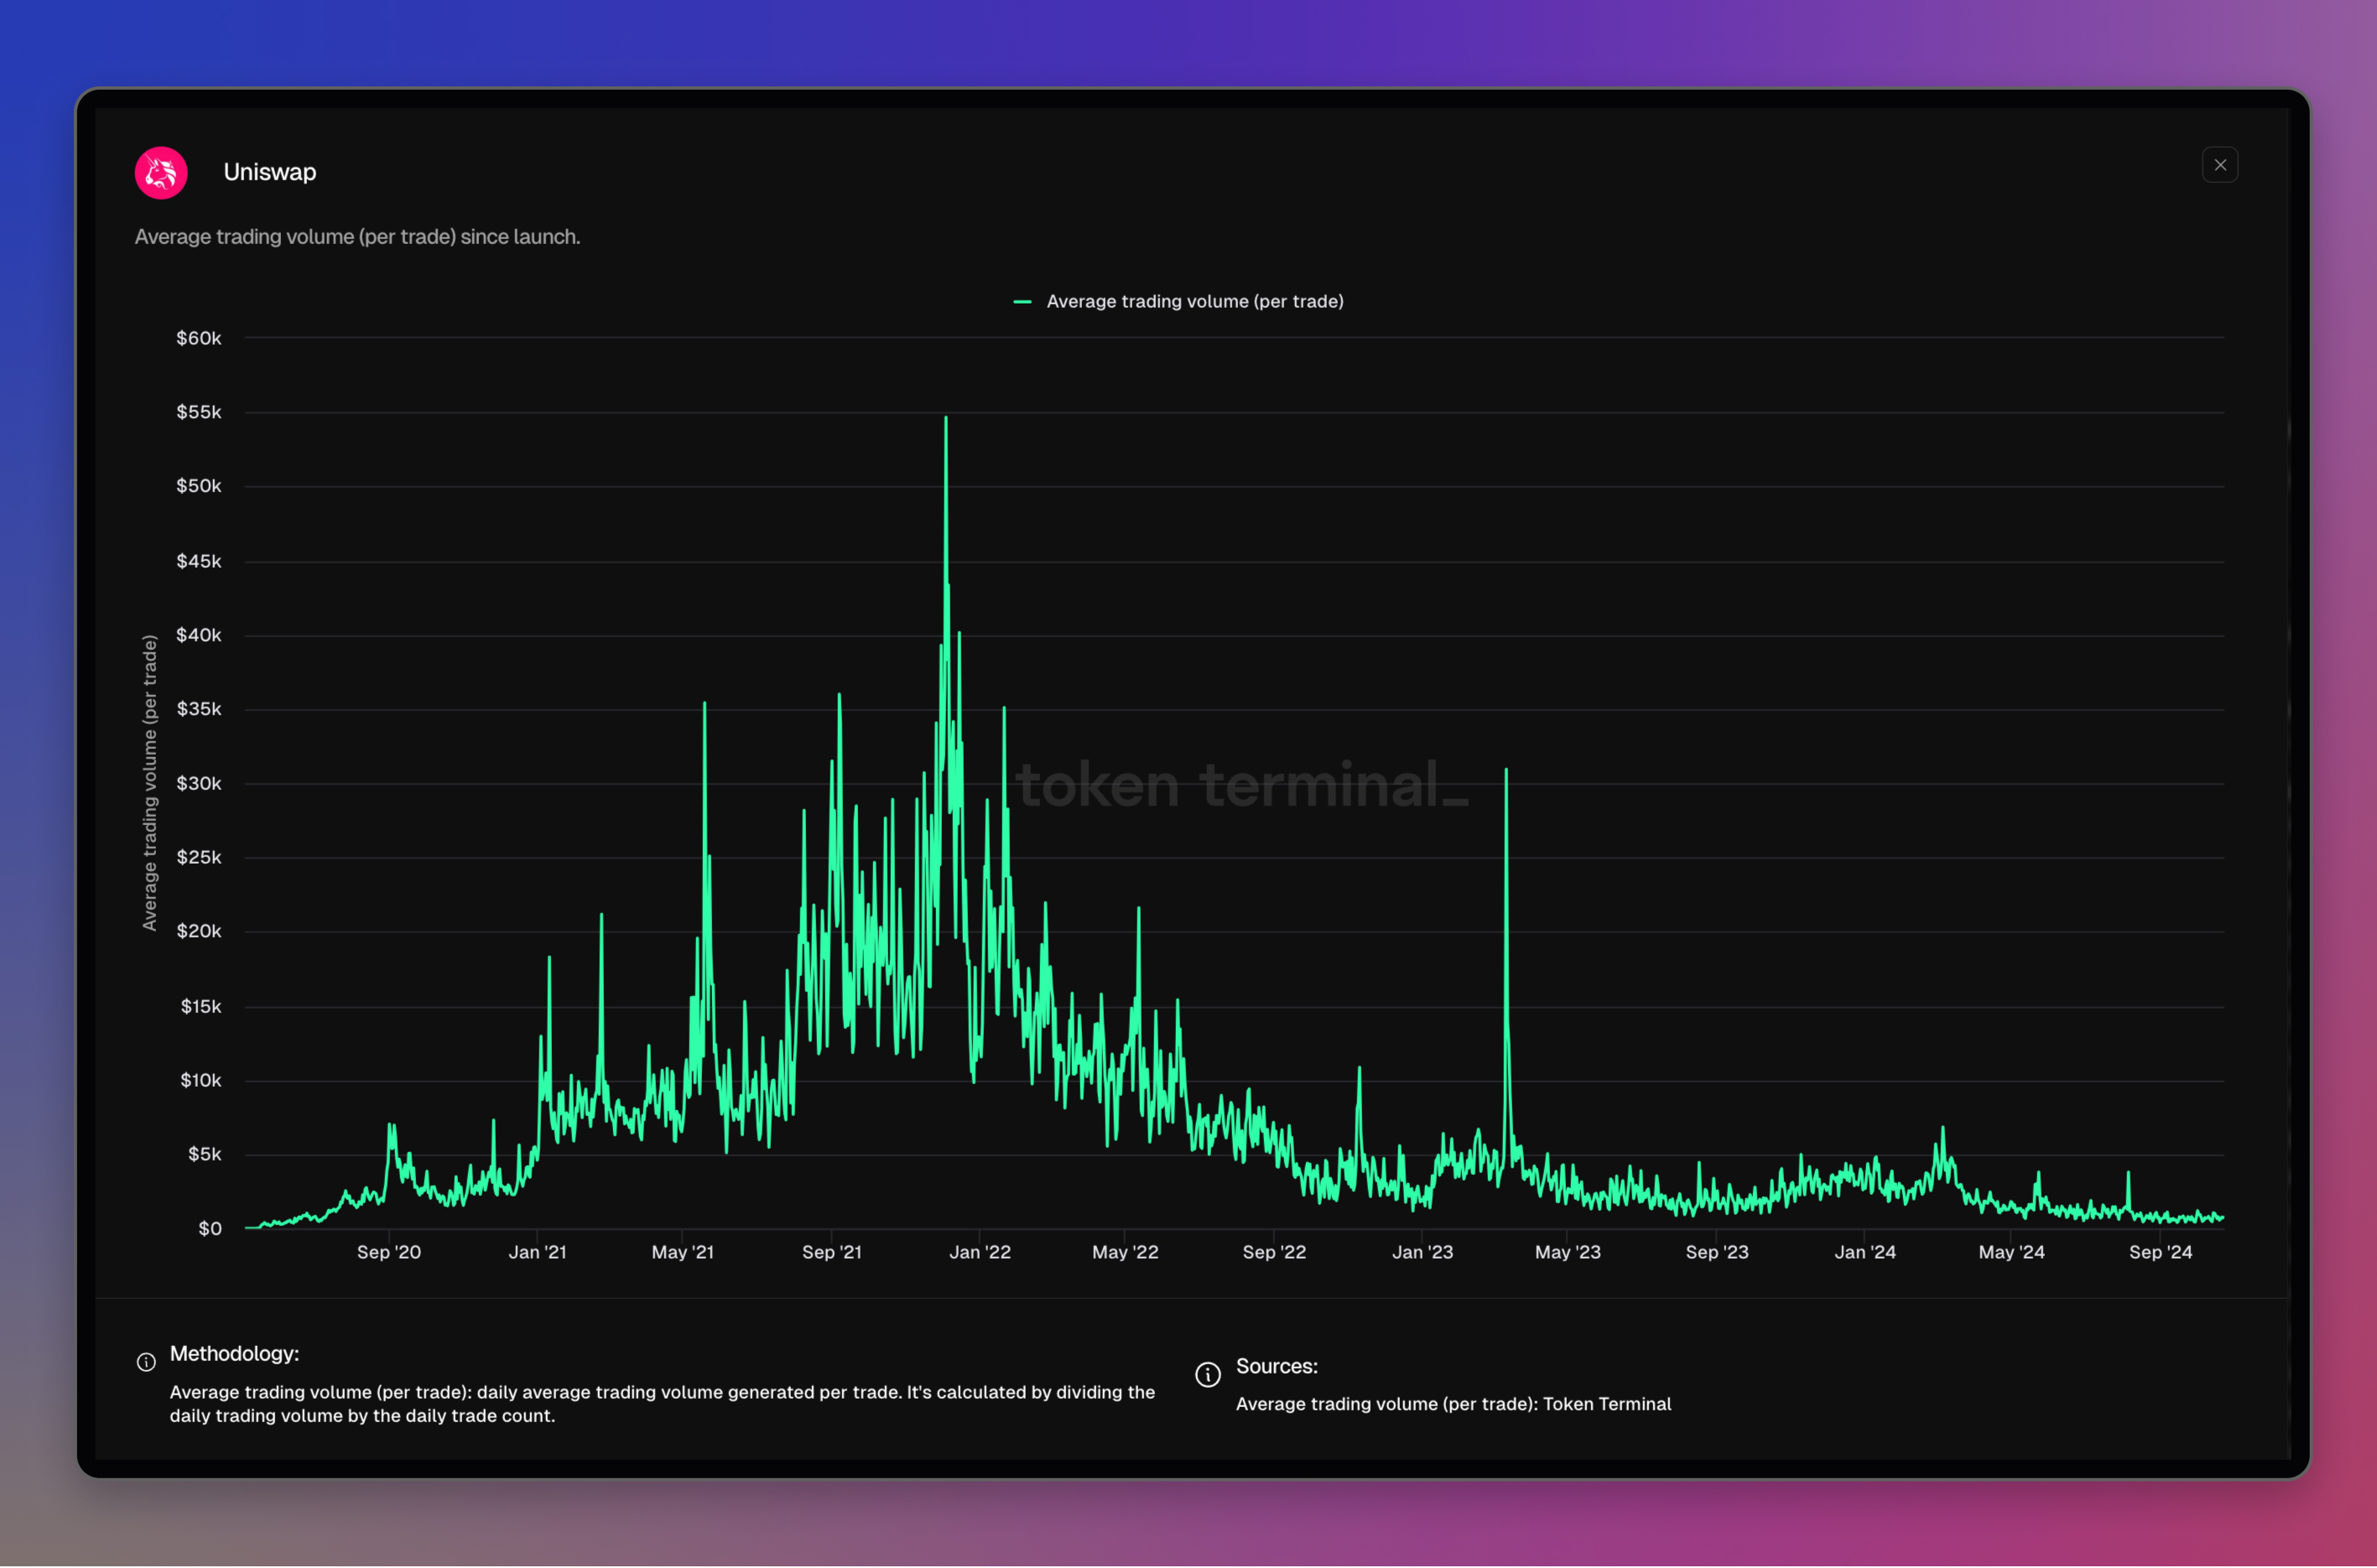
Uniswap dashboard: https://tokenterminal.com/terminal/projects/uniswap
Average trading volume (per user)
What is this metric: Average trading volume (per user) is a measurement of how much daily trading volume, on average, is generated by one user.
How it is calculated: Average trading volume (per user) is calculated as trading volume divided by number of active users, sourced from onchain data. For exchanges, users are defined as daily distinct traders.
Why do we show it: The metric works as a proxy for how the DEX is used. It helps us understand user behavior. High values indicate high trading volume contributions relative to the number of users. Low values suggest that most users are generating little trading volume.
Example:
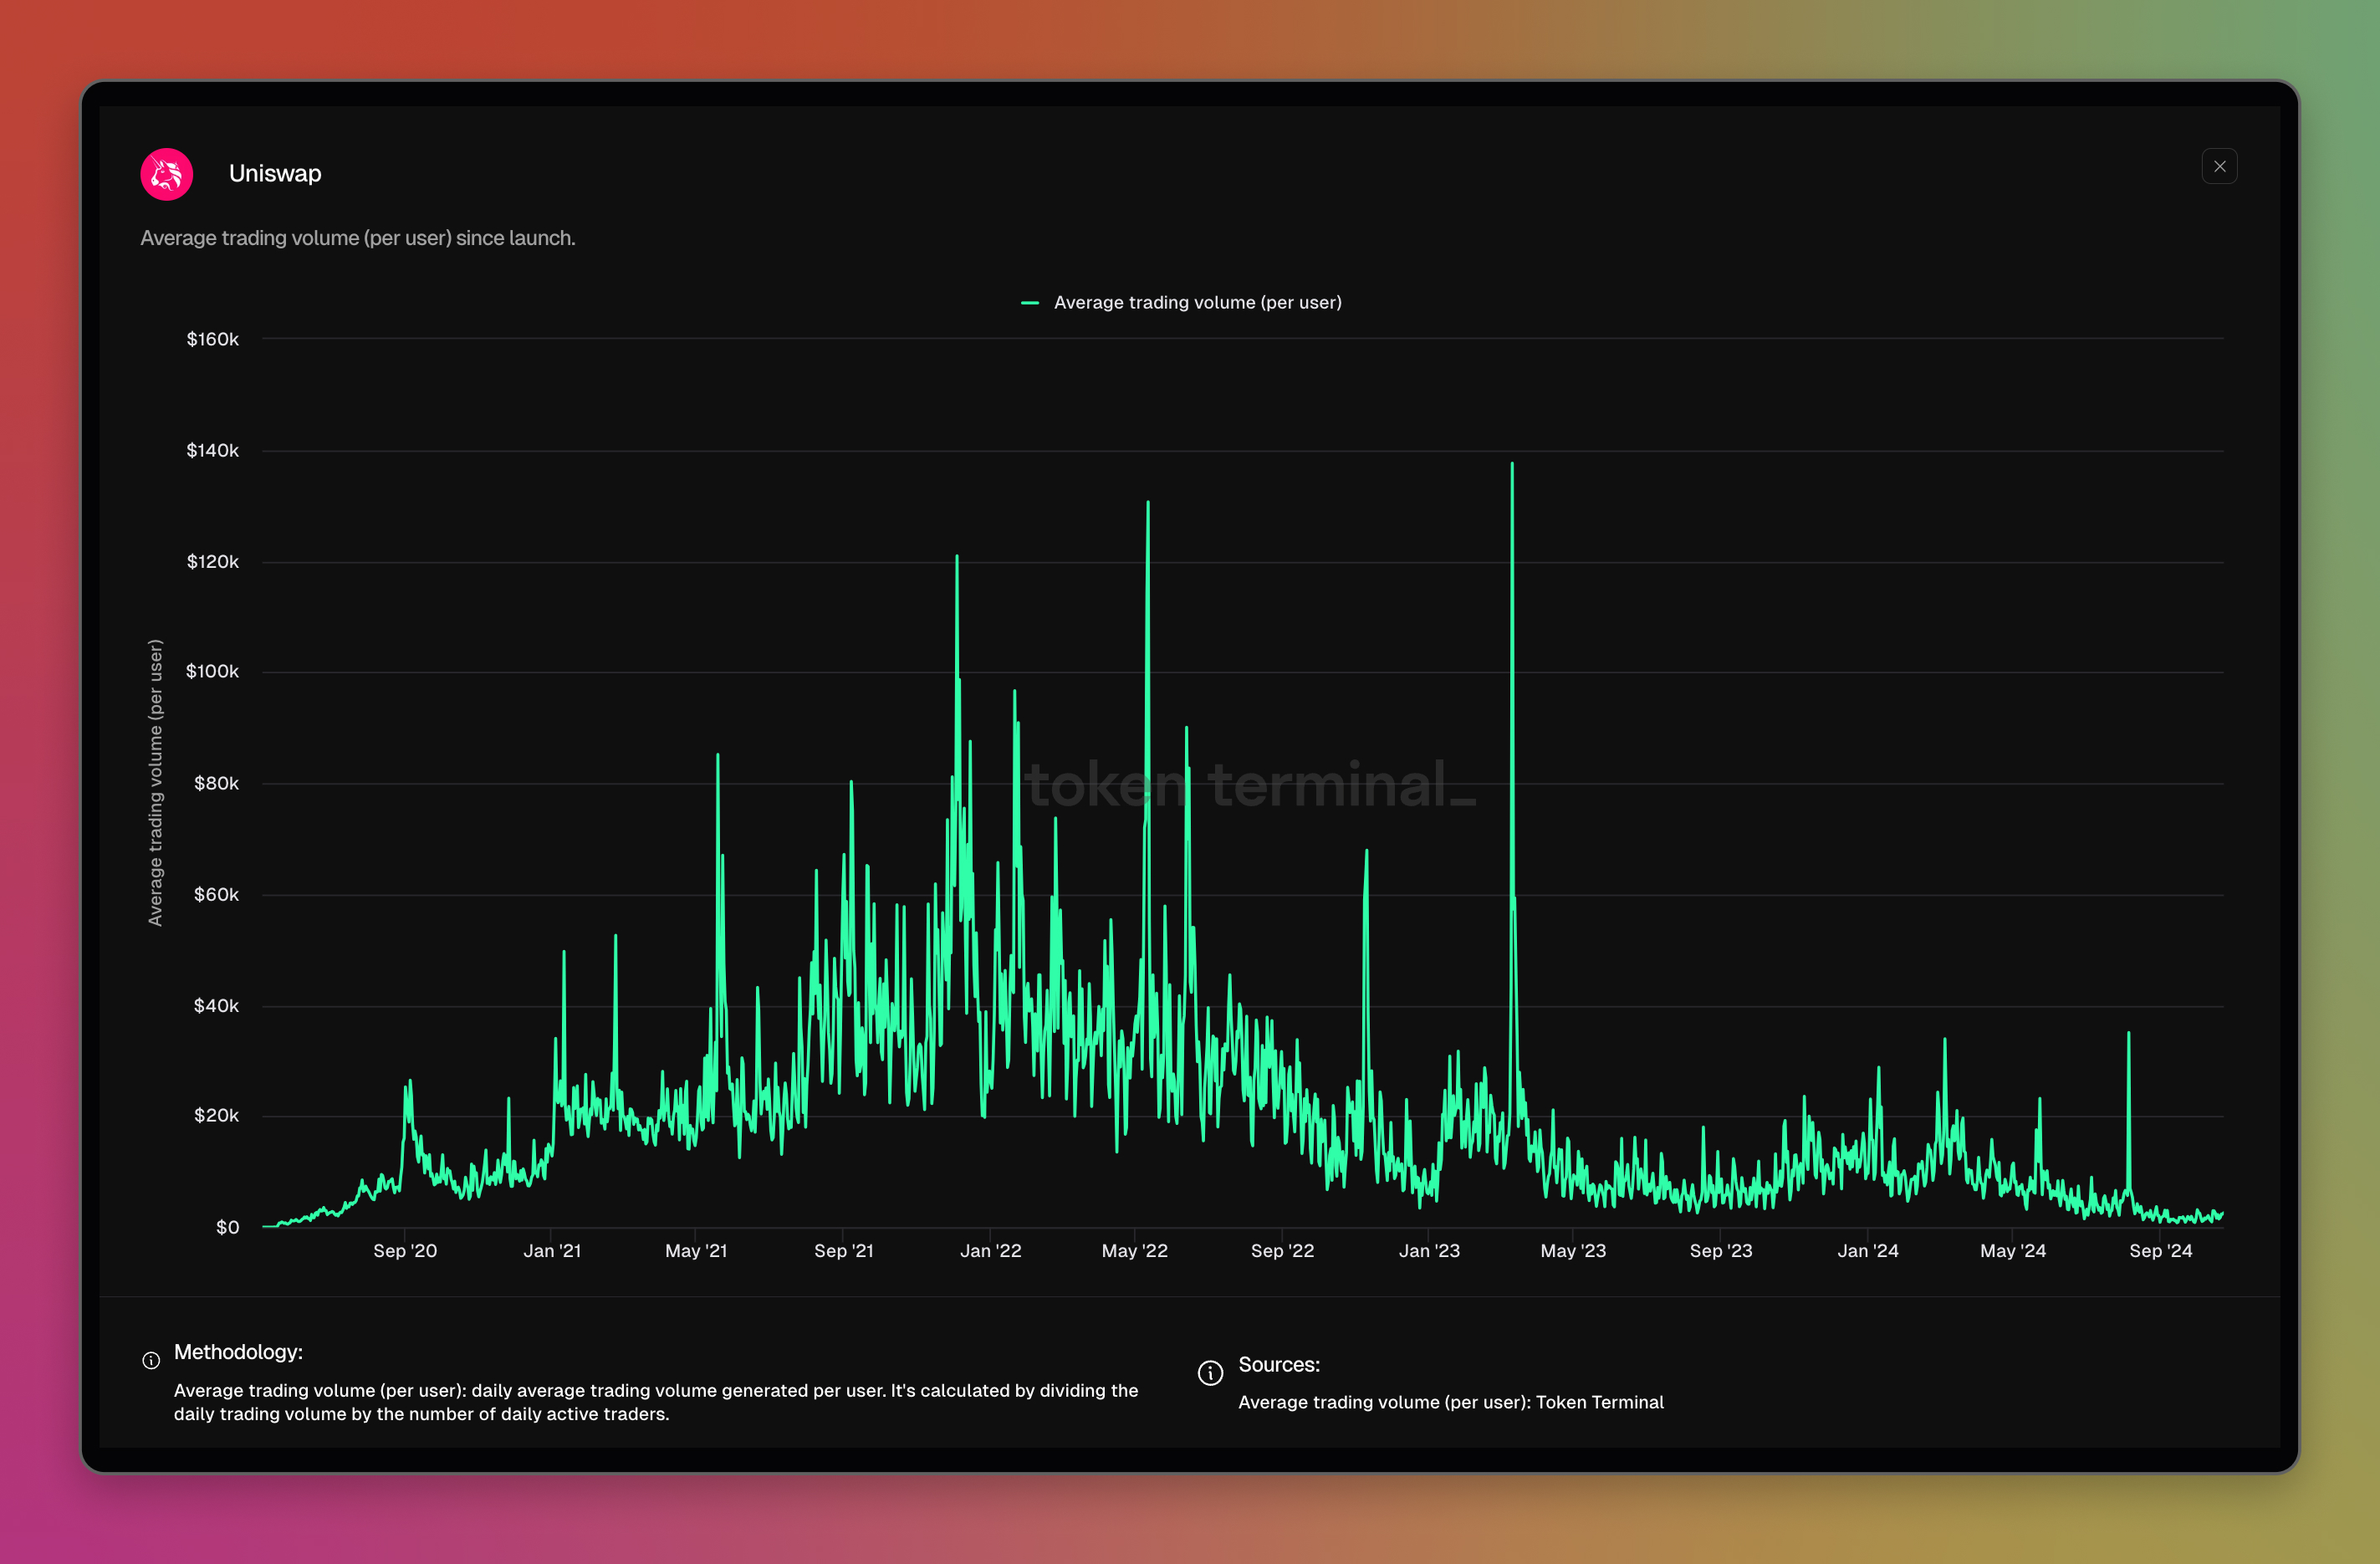
Uniswap dashboard: https://tokenterminal.com/terminal/projects/uniswap
Average transaction fee
What is this metric: Average fee per transaction.
How it is calculated: Transaction fees divided by transaction count.
Why do we show it: Indicates how much a user pays per transaction on average. This helps understand how the chain is used: a high average transaction fee may not be suitable for small everyday transactions, and may indicate that the chain is used as a final settlement layer instead (e.g., Ethereum).
Example:
](https://files.readme.io/1d98fd559a4b7dfda8e898bd6e84b82fc651c067a99f9f095341bb3c26463e4a-Ronin_-_Avg_Transaction_Fee.jpg)
Ronin dashboard: https://tokenterminal.com/terminal/projects/ronin
Block time
What is this metric: Average time elapsed between the addition of successive blocks to a blockchain.
How it is calculated: Block timestamps are sourced from onchain data, and the time elapsed between successive blocks is calculated and averaged during a specified time period (e.g. a day).
Why do we show it: Block times influence how long users need to wait before their transactions are confirmed. A measure of how frequently new blocks are added to blockchains can be useful to compare different blockchains or evaluate the effect of upgrades on a particular chain. A deviation from "normal" parameters may coincide with periods of degraded performance or other technical issues.
Code commits
What is this metric: New commits to the protocol's public GitHub repositories.
How it is calculated: Number of commits to the protocol's public repositories, sourced from GitHub.
Why do we show it: Important to know if there are few vs. many regular commits, gives a better understanding of the pace of development.
Example:
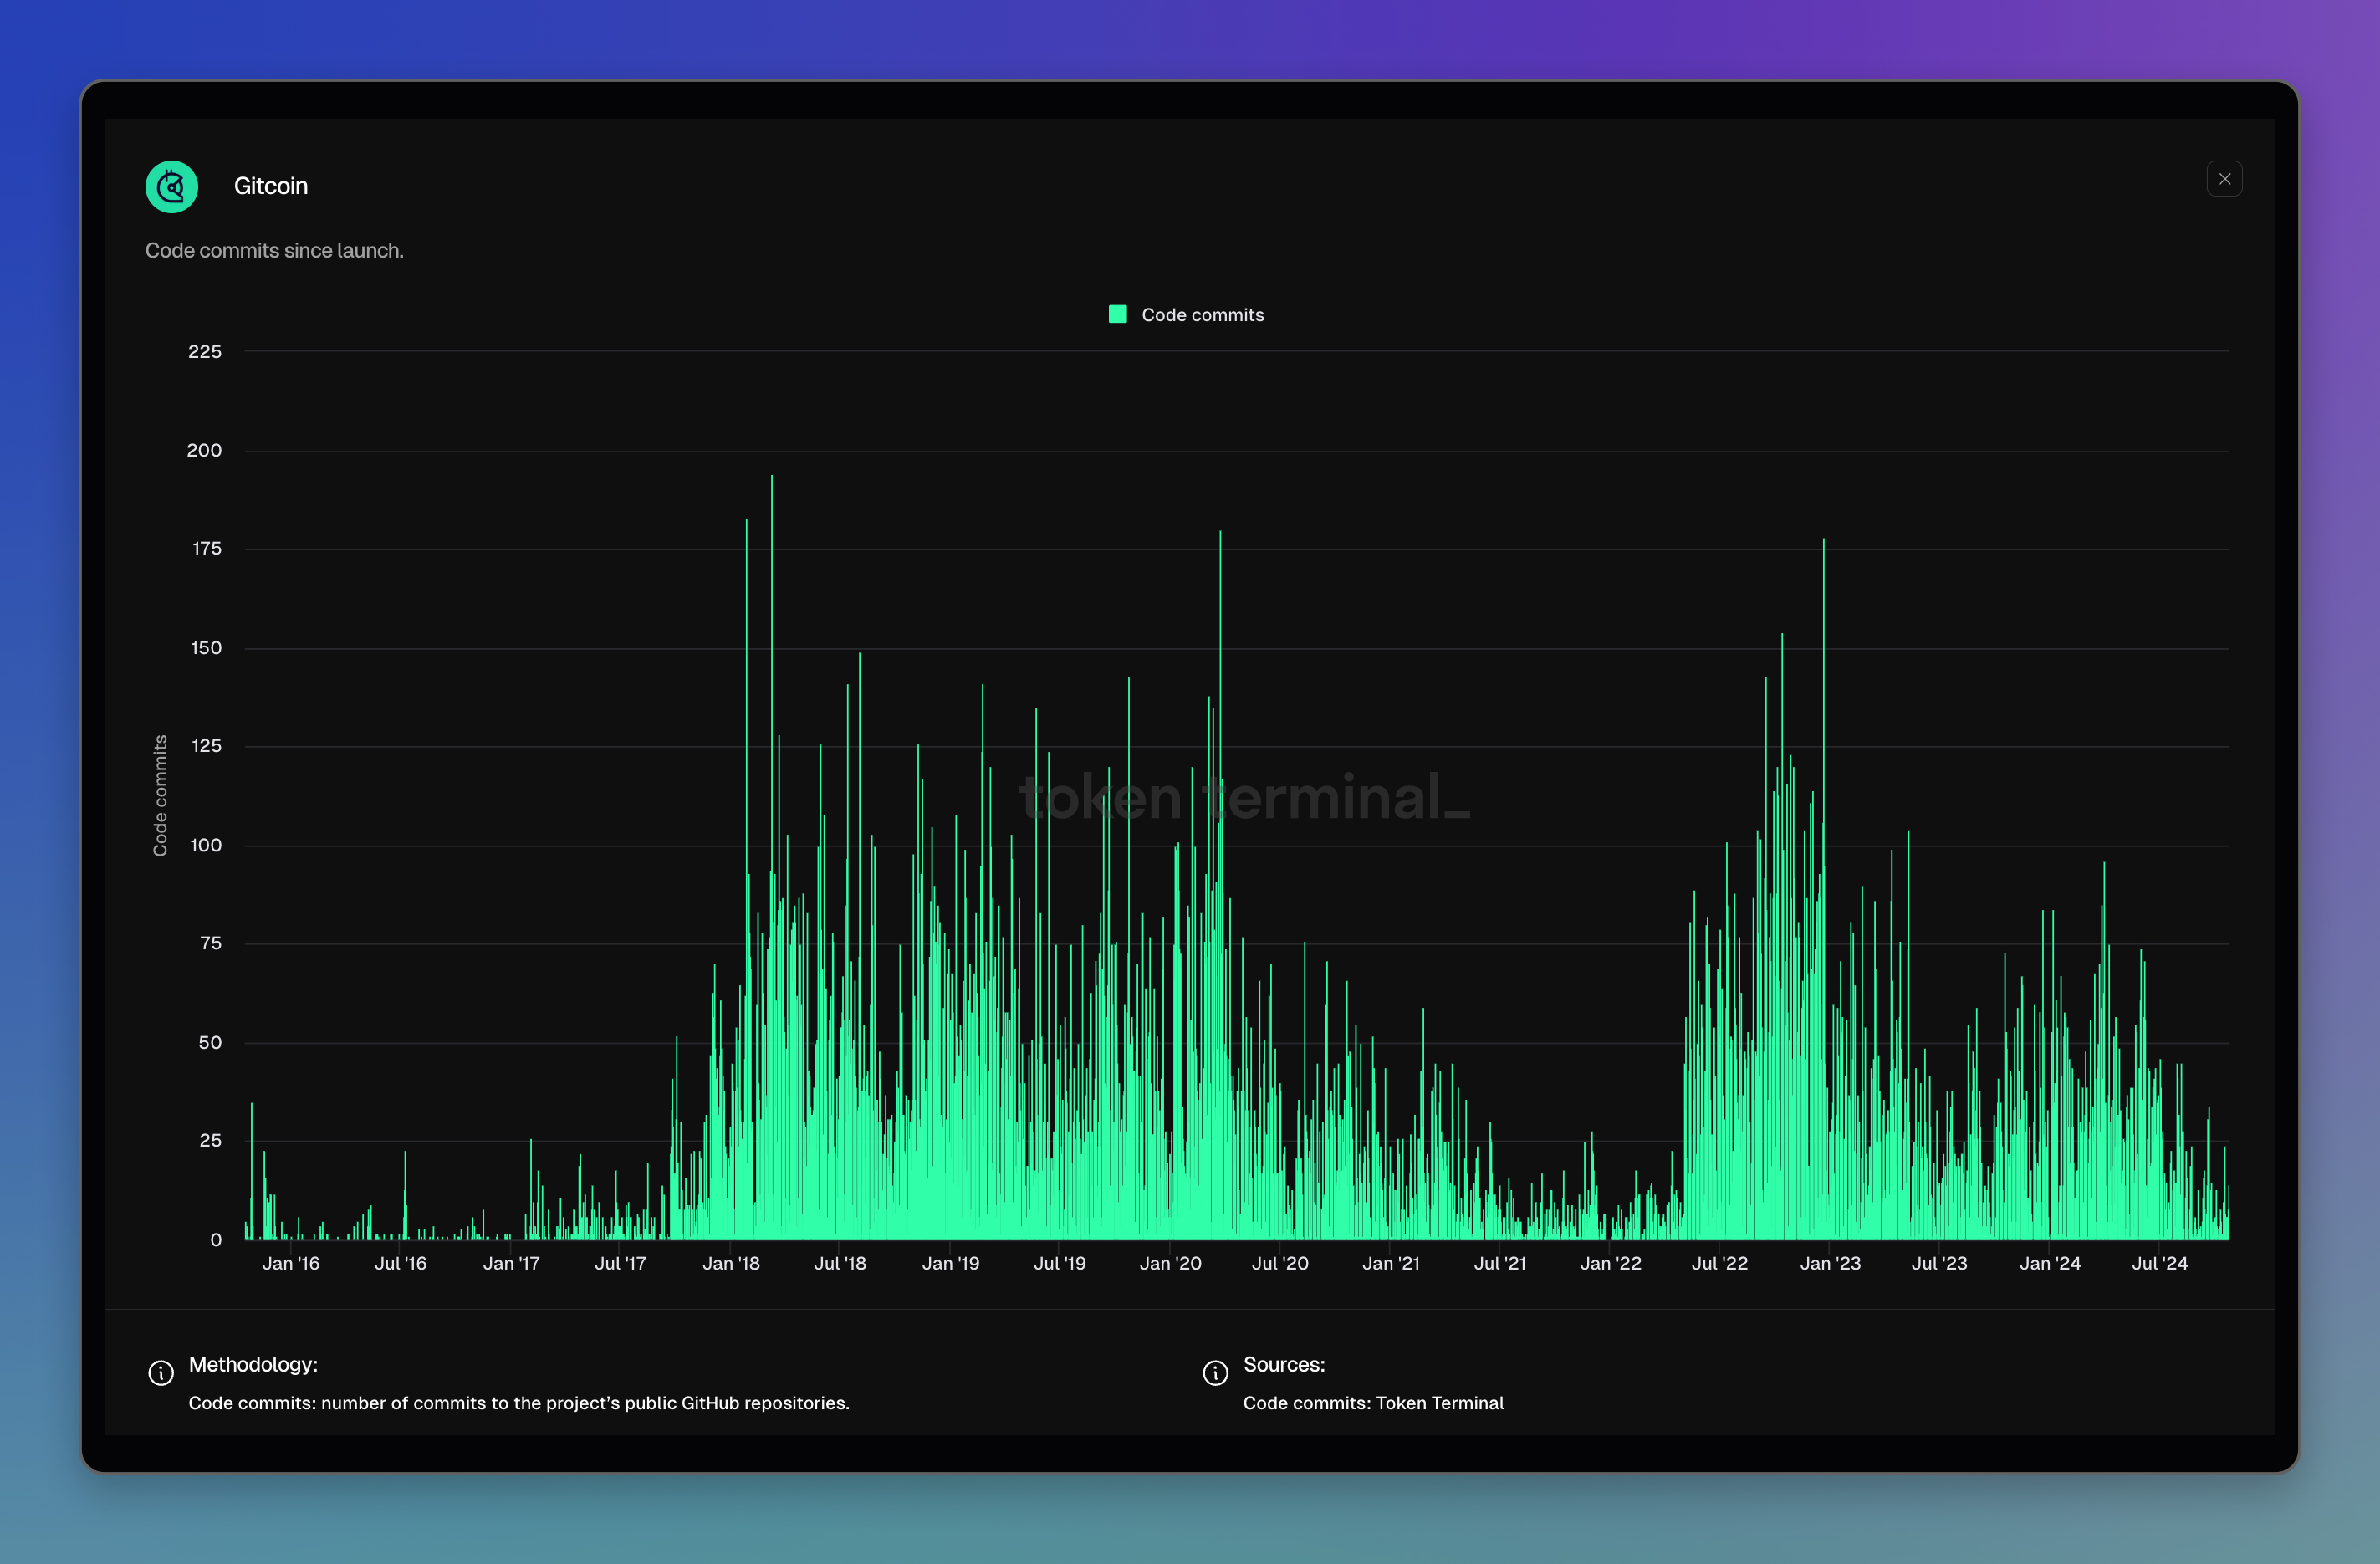
Gitcoin dashboard: https://tokenterminal.com/terminal/projects/gitcoin
Core developers
What is this metric: Core developers that contribute to the protocol's public GitHub repositories.
How it is calculated: Number of distinct users that made 1+ commits to the protocol's public repositories during the past 30 days, sourced from GitHub.
Why do we show it: Important to know if there are 10 vs. 100 core developers, gives a better understanding of the contributor dependencies.
Example:
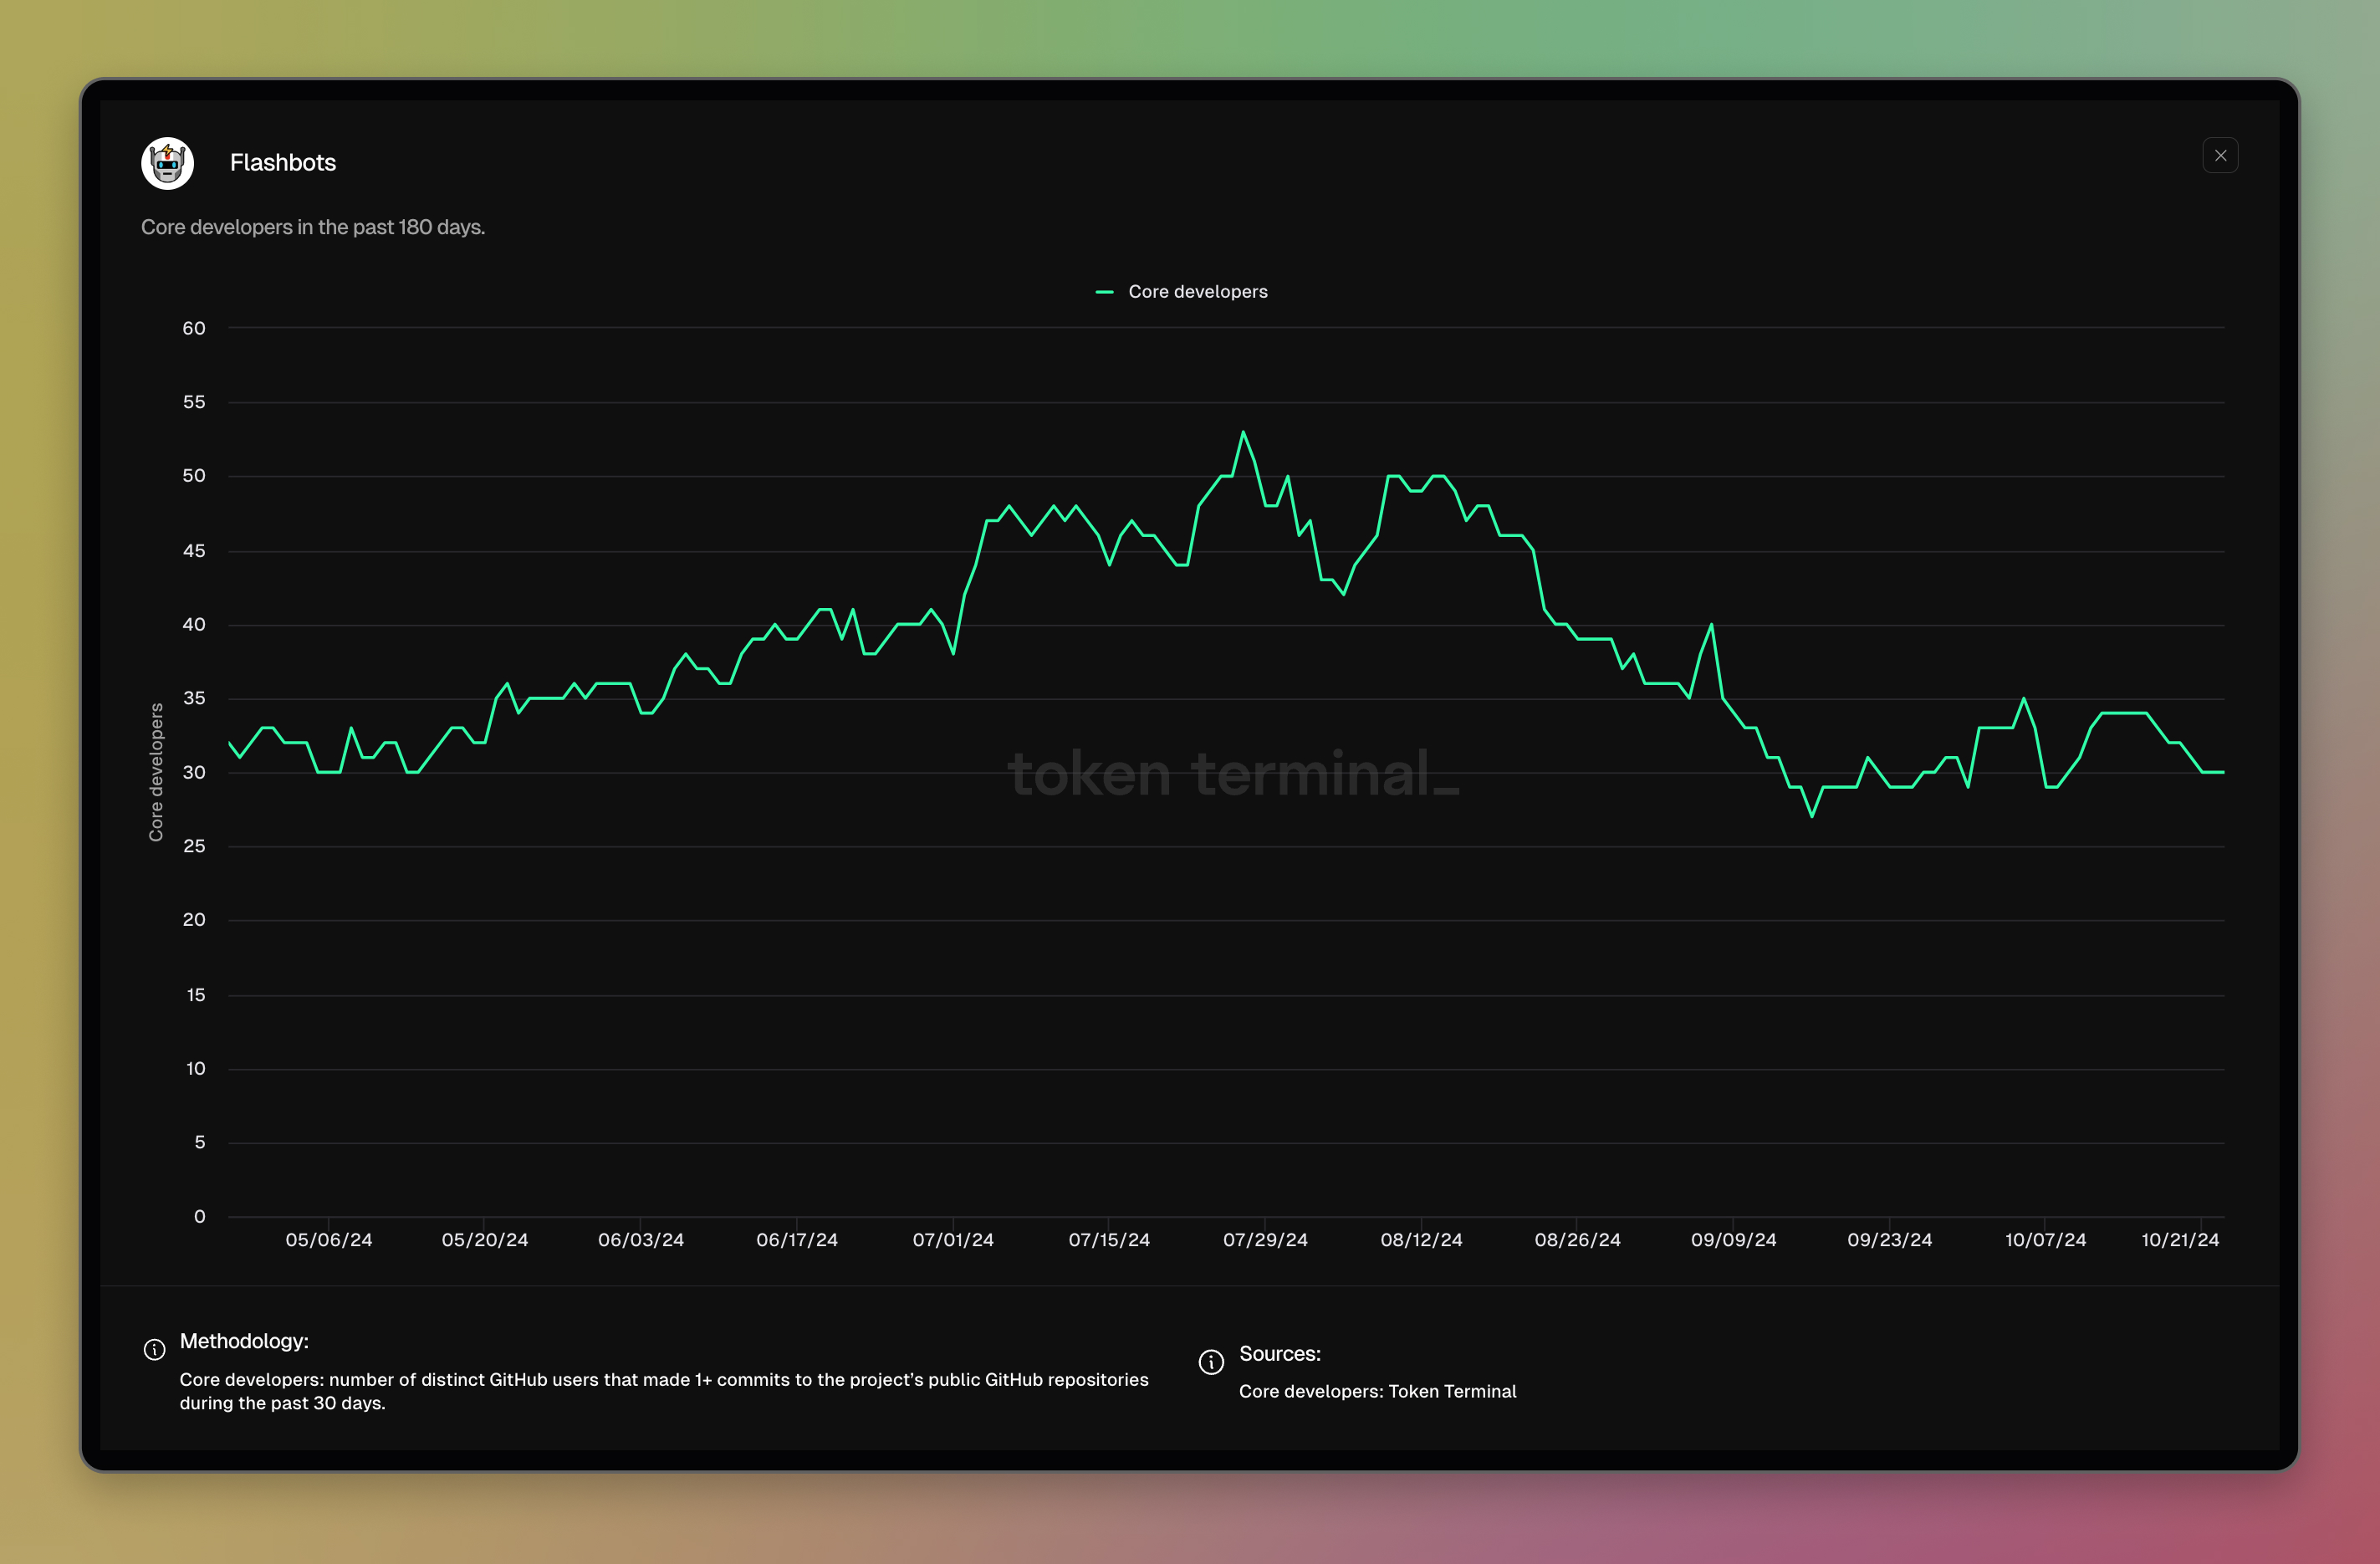
Flashbots dashboard: https://tokenterminal.com/terminal/projects/flashbots
Contracts deployed
What is this metric: Number of smart contracts deployed on the network.
How it is calculated: Number of distinct smart contracts that are successfully deployed through contract creation transactions, sourced from onchain data.
Why do we show it: A proxy to the number of blockchain applications being deployed to the network.
Example:
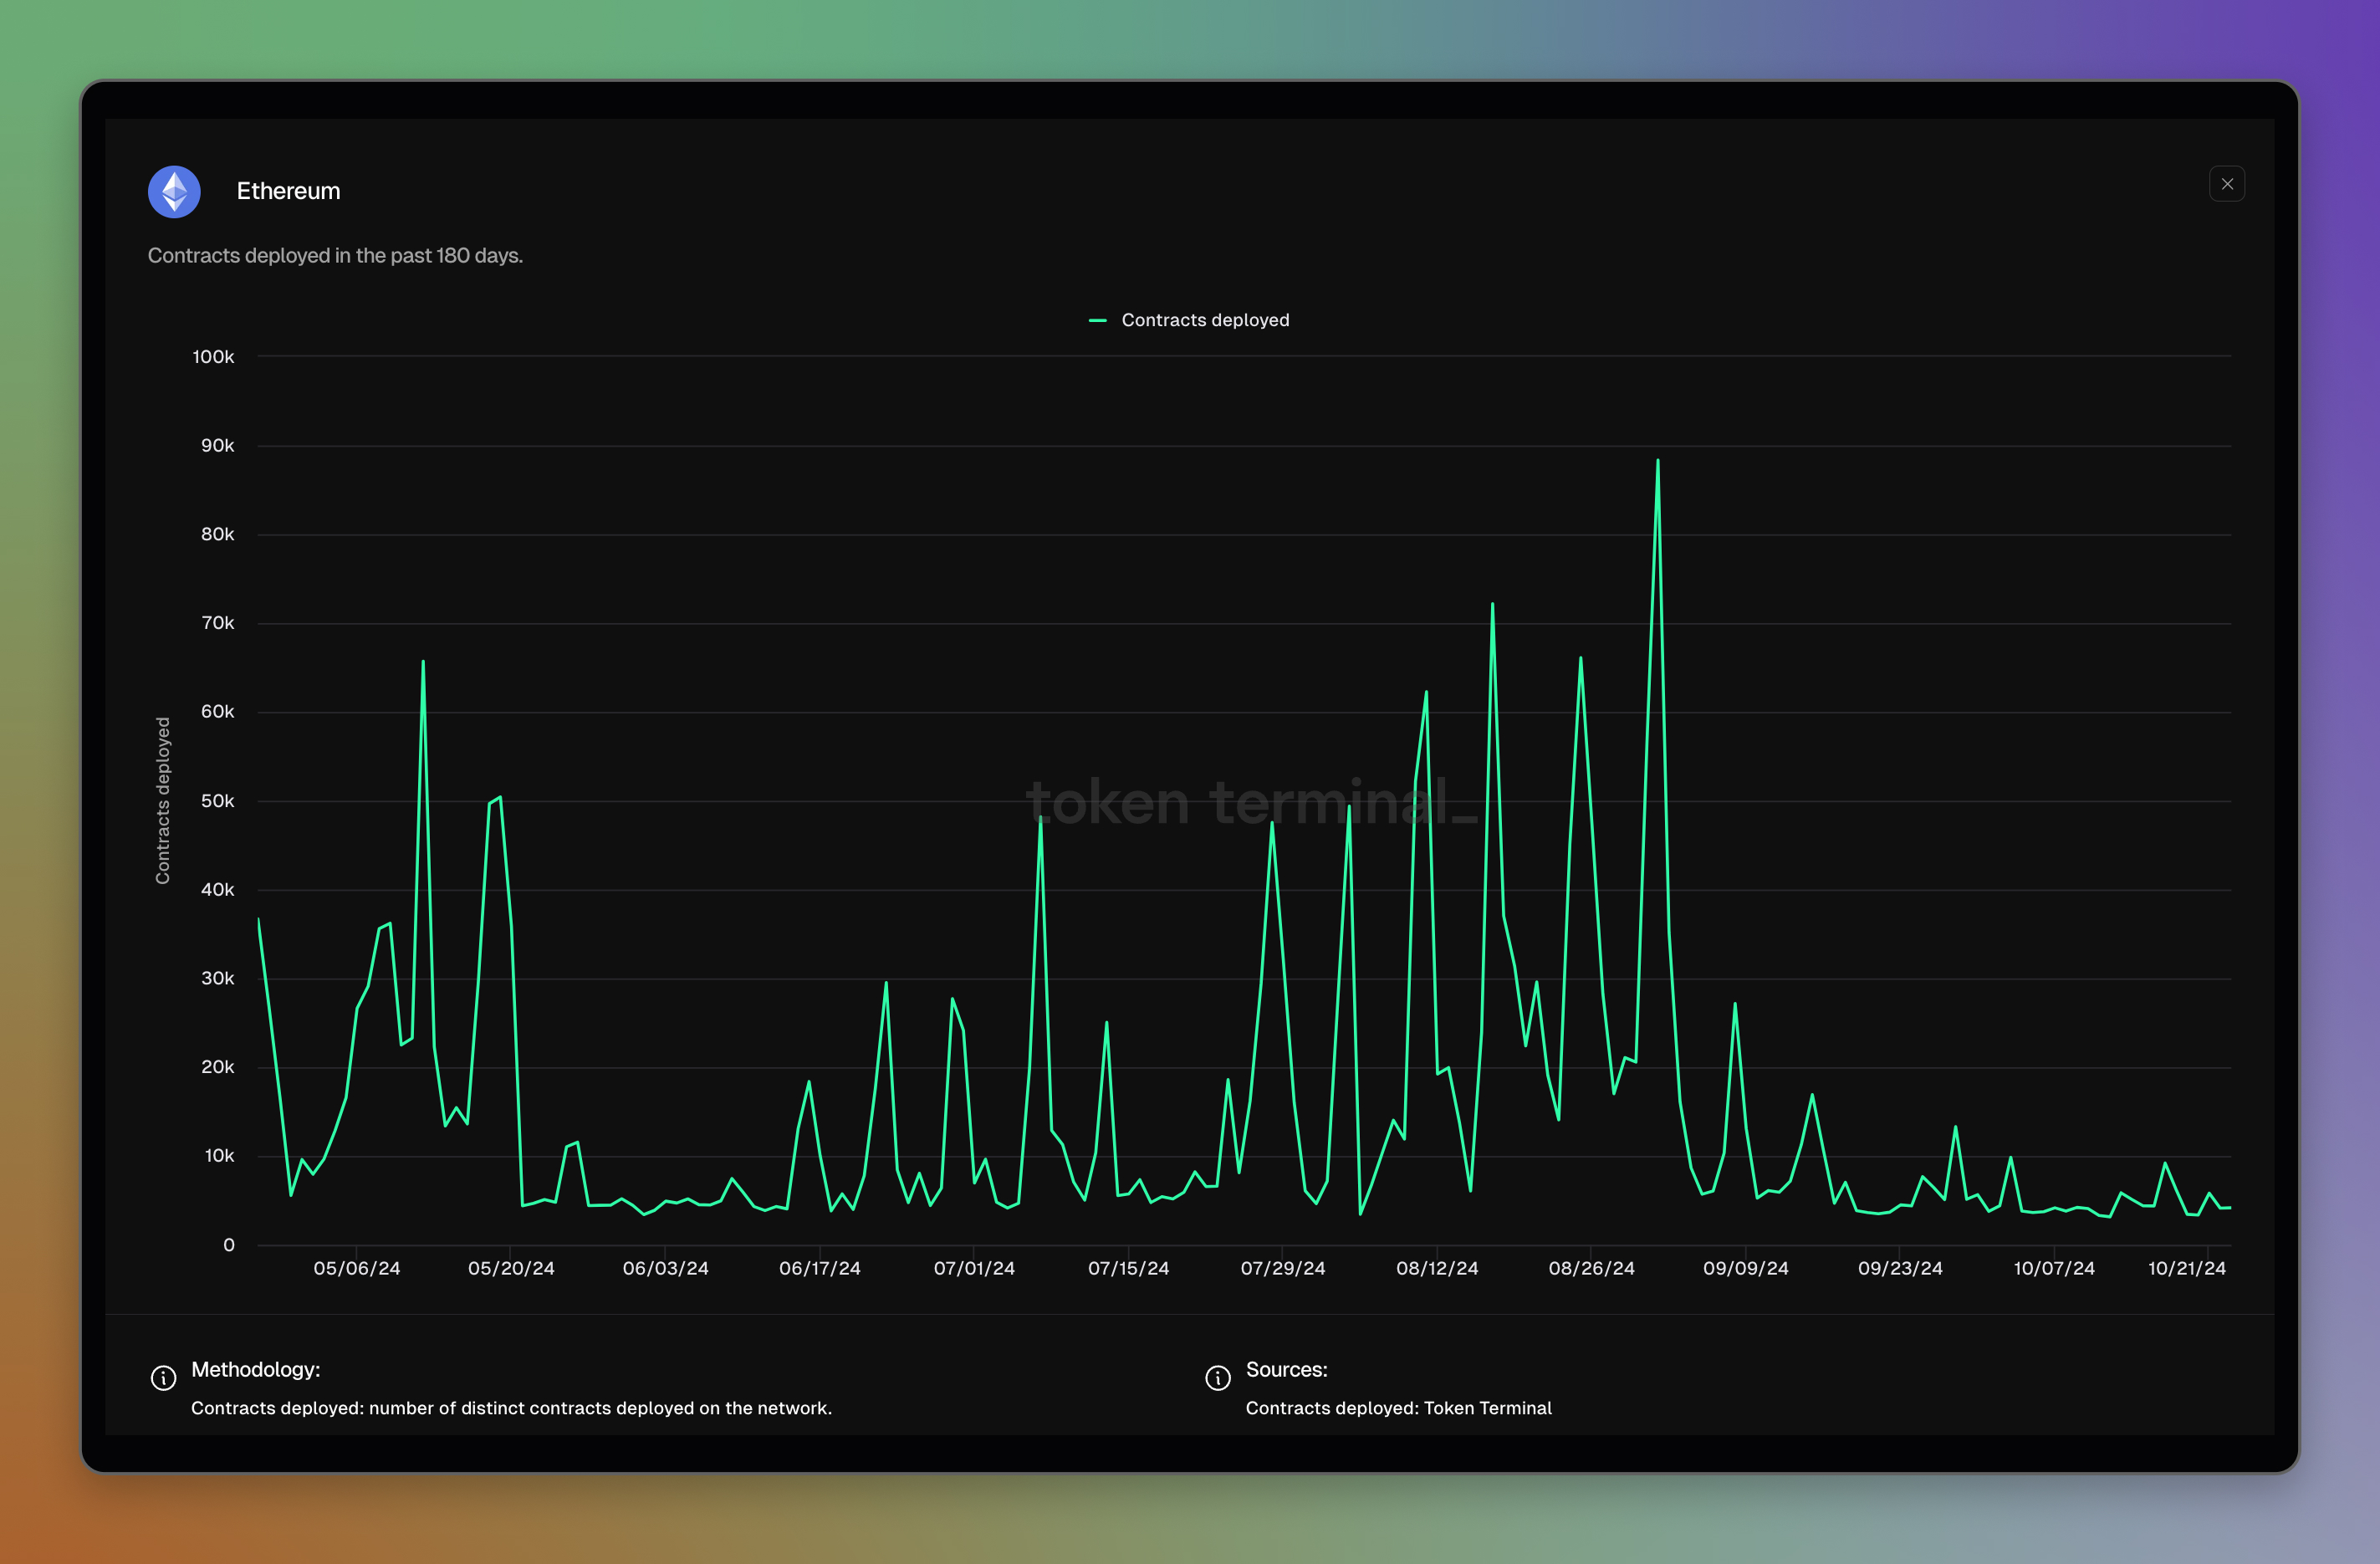
Ethereum dashboard: https://tokenterminal.com/terminal/projects/ethereum
Contract deployers
What is this metric: Number of externally-owned accounts (EOAs) that initiate transactions where contract creations occur.
How it is calculated: Number of distinct EOAs that initiate transactions where contract creations occur, sourced from onchain data.
Why do we show it: A proxy to the number of blockchain users deploying smart contracts.
Example:
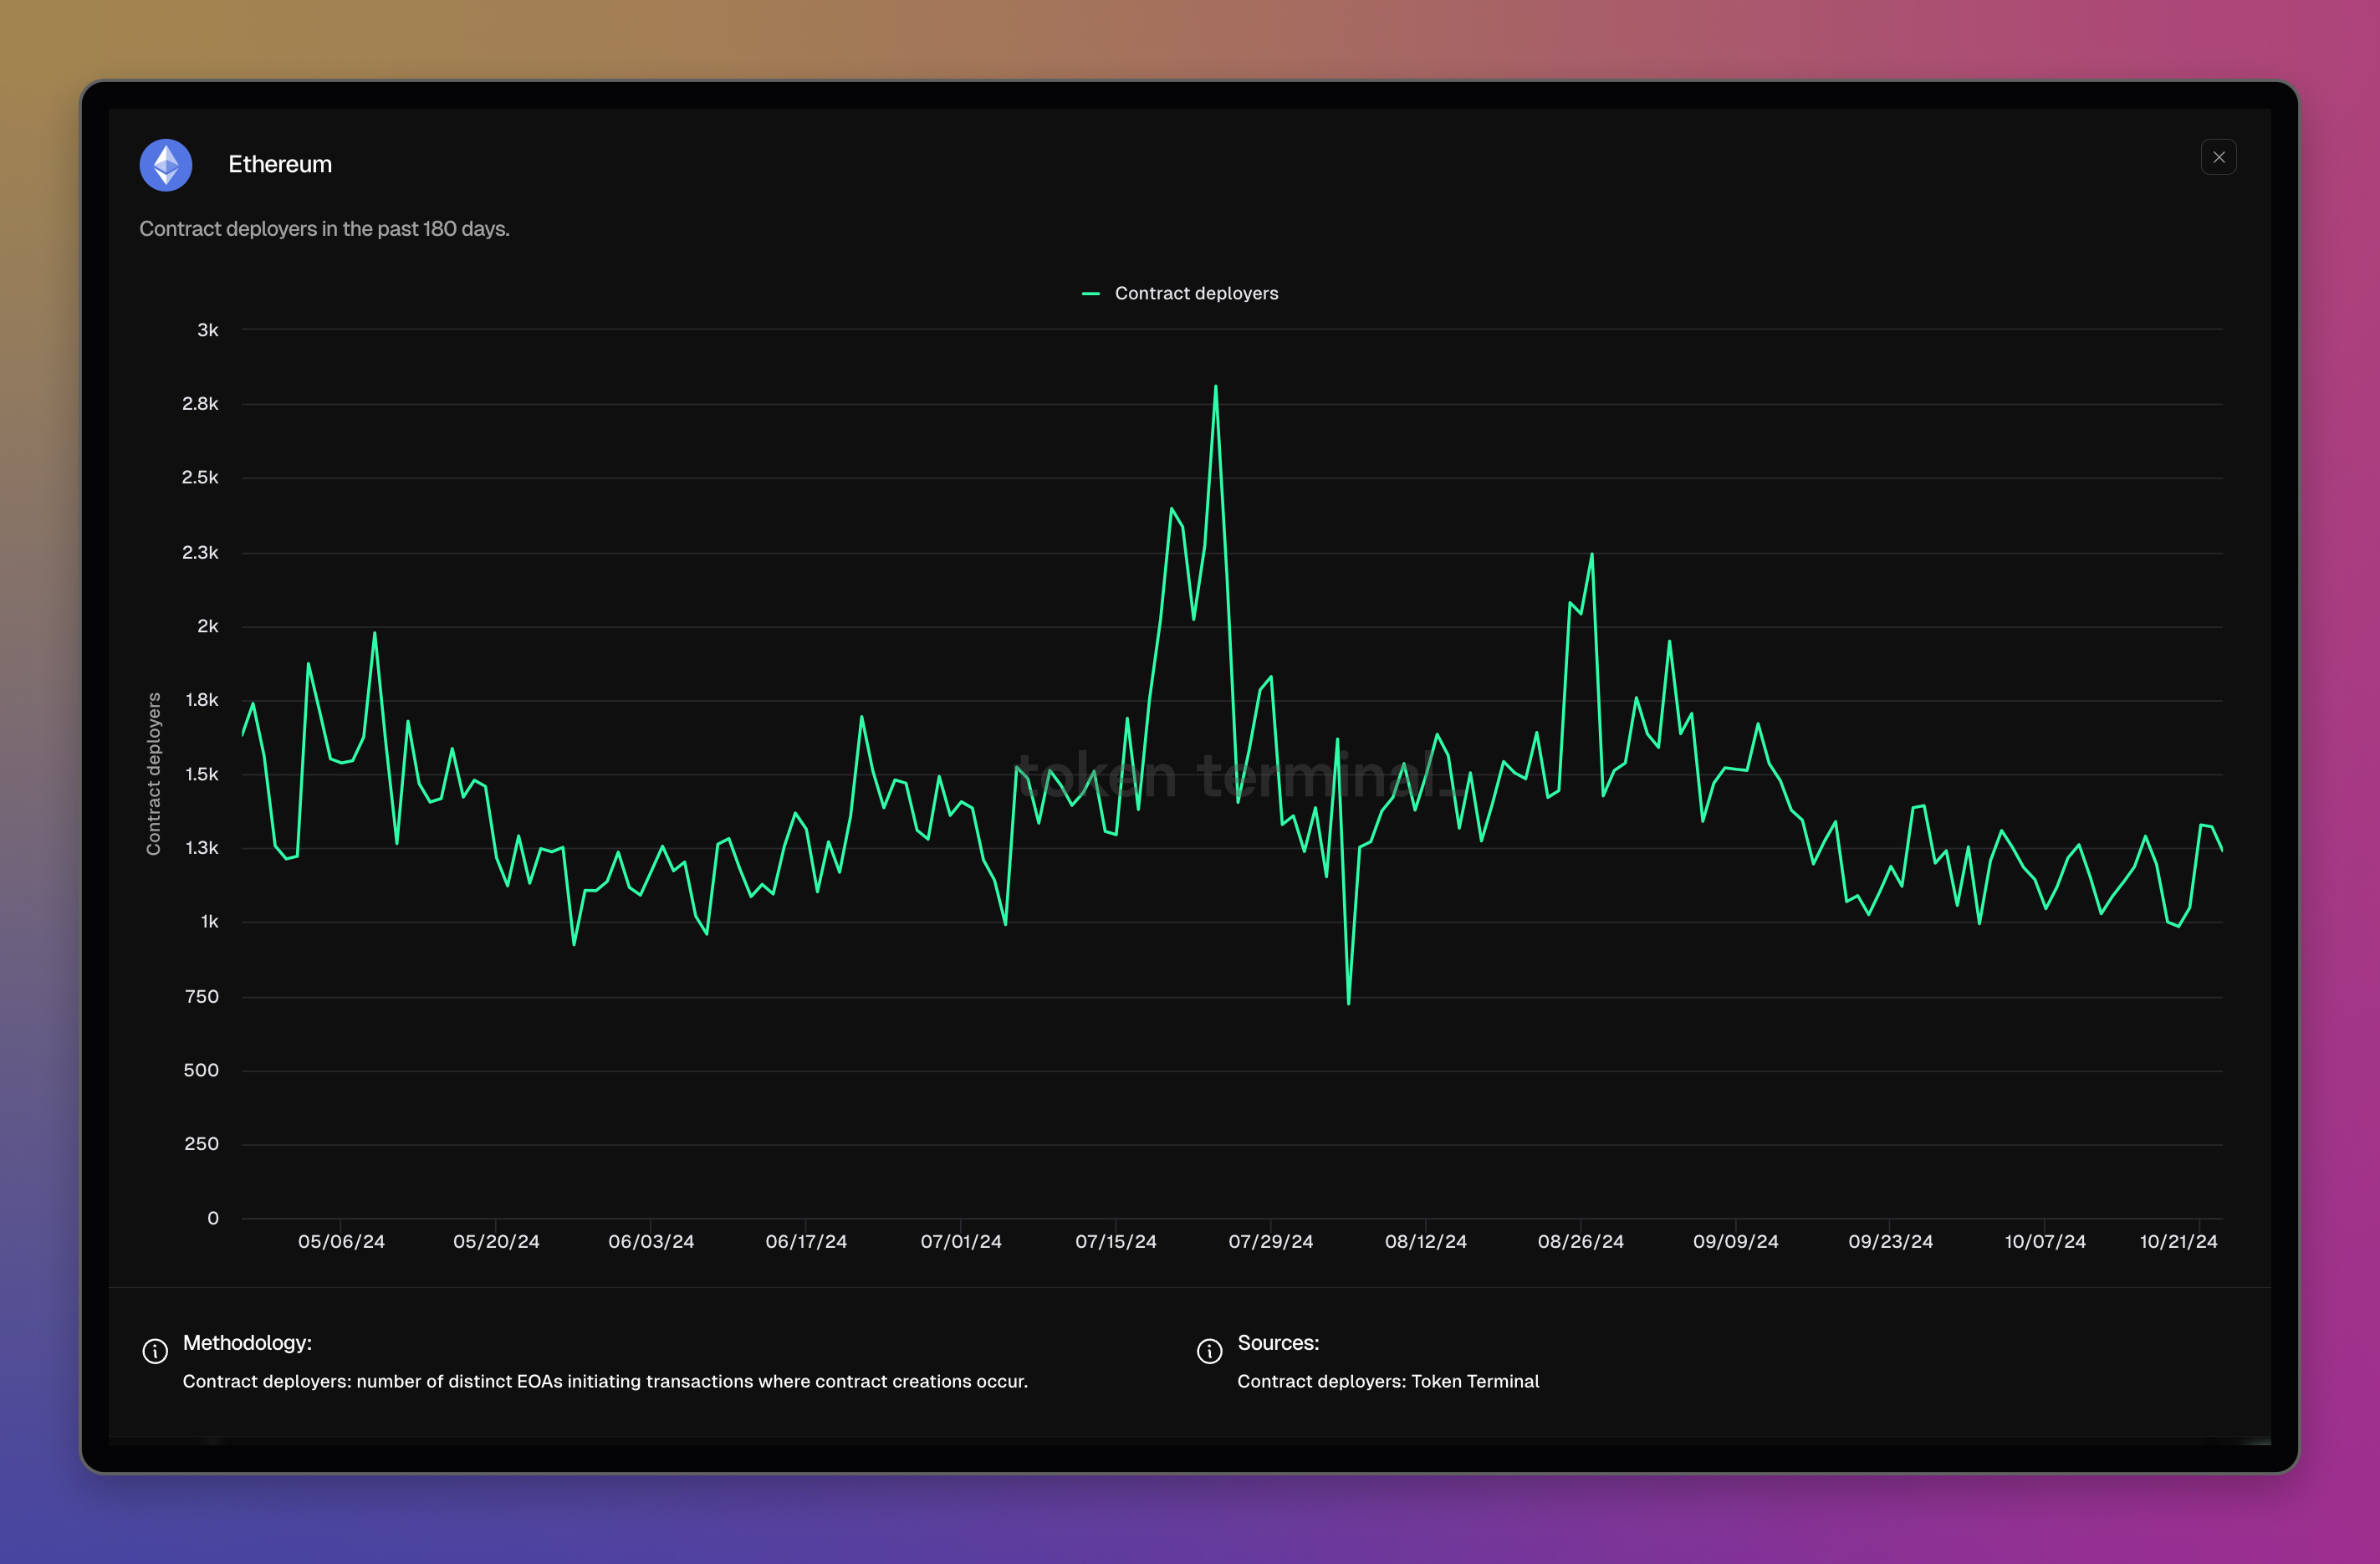
Ethereum dashboard: https://tokenterminal.com/terminal/projects/ethereum
Liquidity turnover
What is this metric: Liquidity turnover is a measurement of how much trading volume a DEX facilitates relative to its total value locked.
How it is calculated: Trading volume divided by total value locked, sourced from onchain data.
Why do we show it: This metric provides a proxy for how capital-efficient a DEX is. A higher liquidity turnover can indicate higher capital efficiency, meaning that the DEX is able to facilitate relatively high trading volumes without having to attract as much liquidity.
Example:
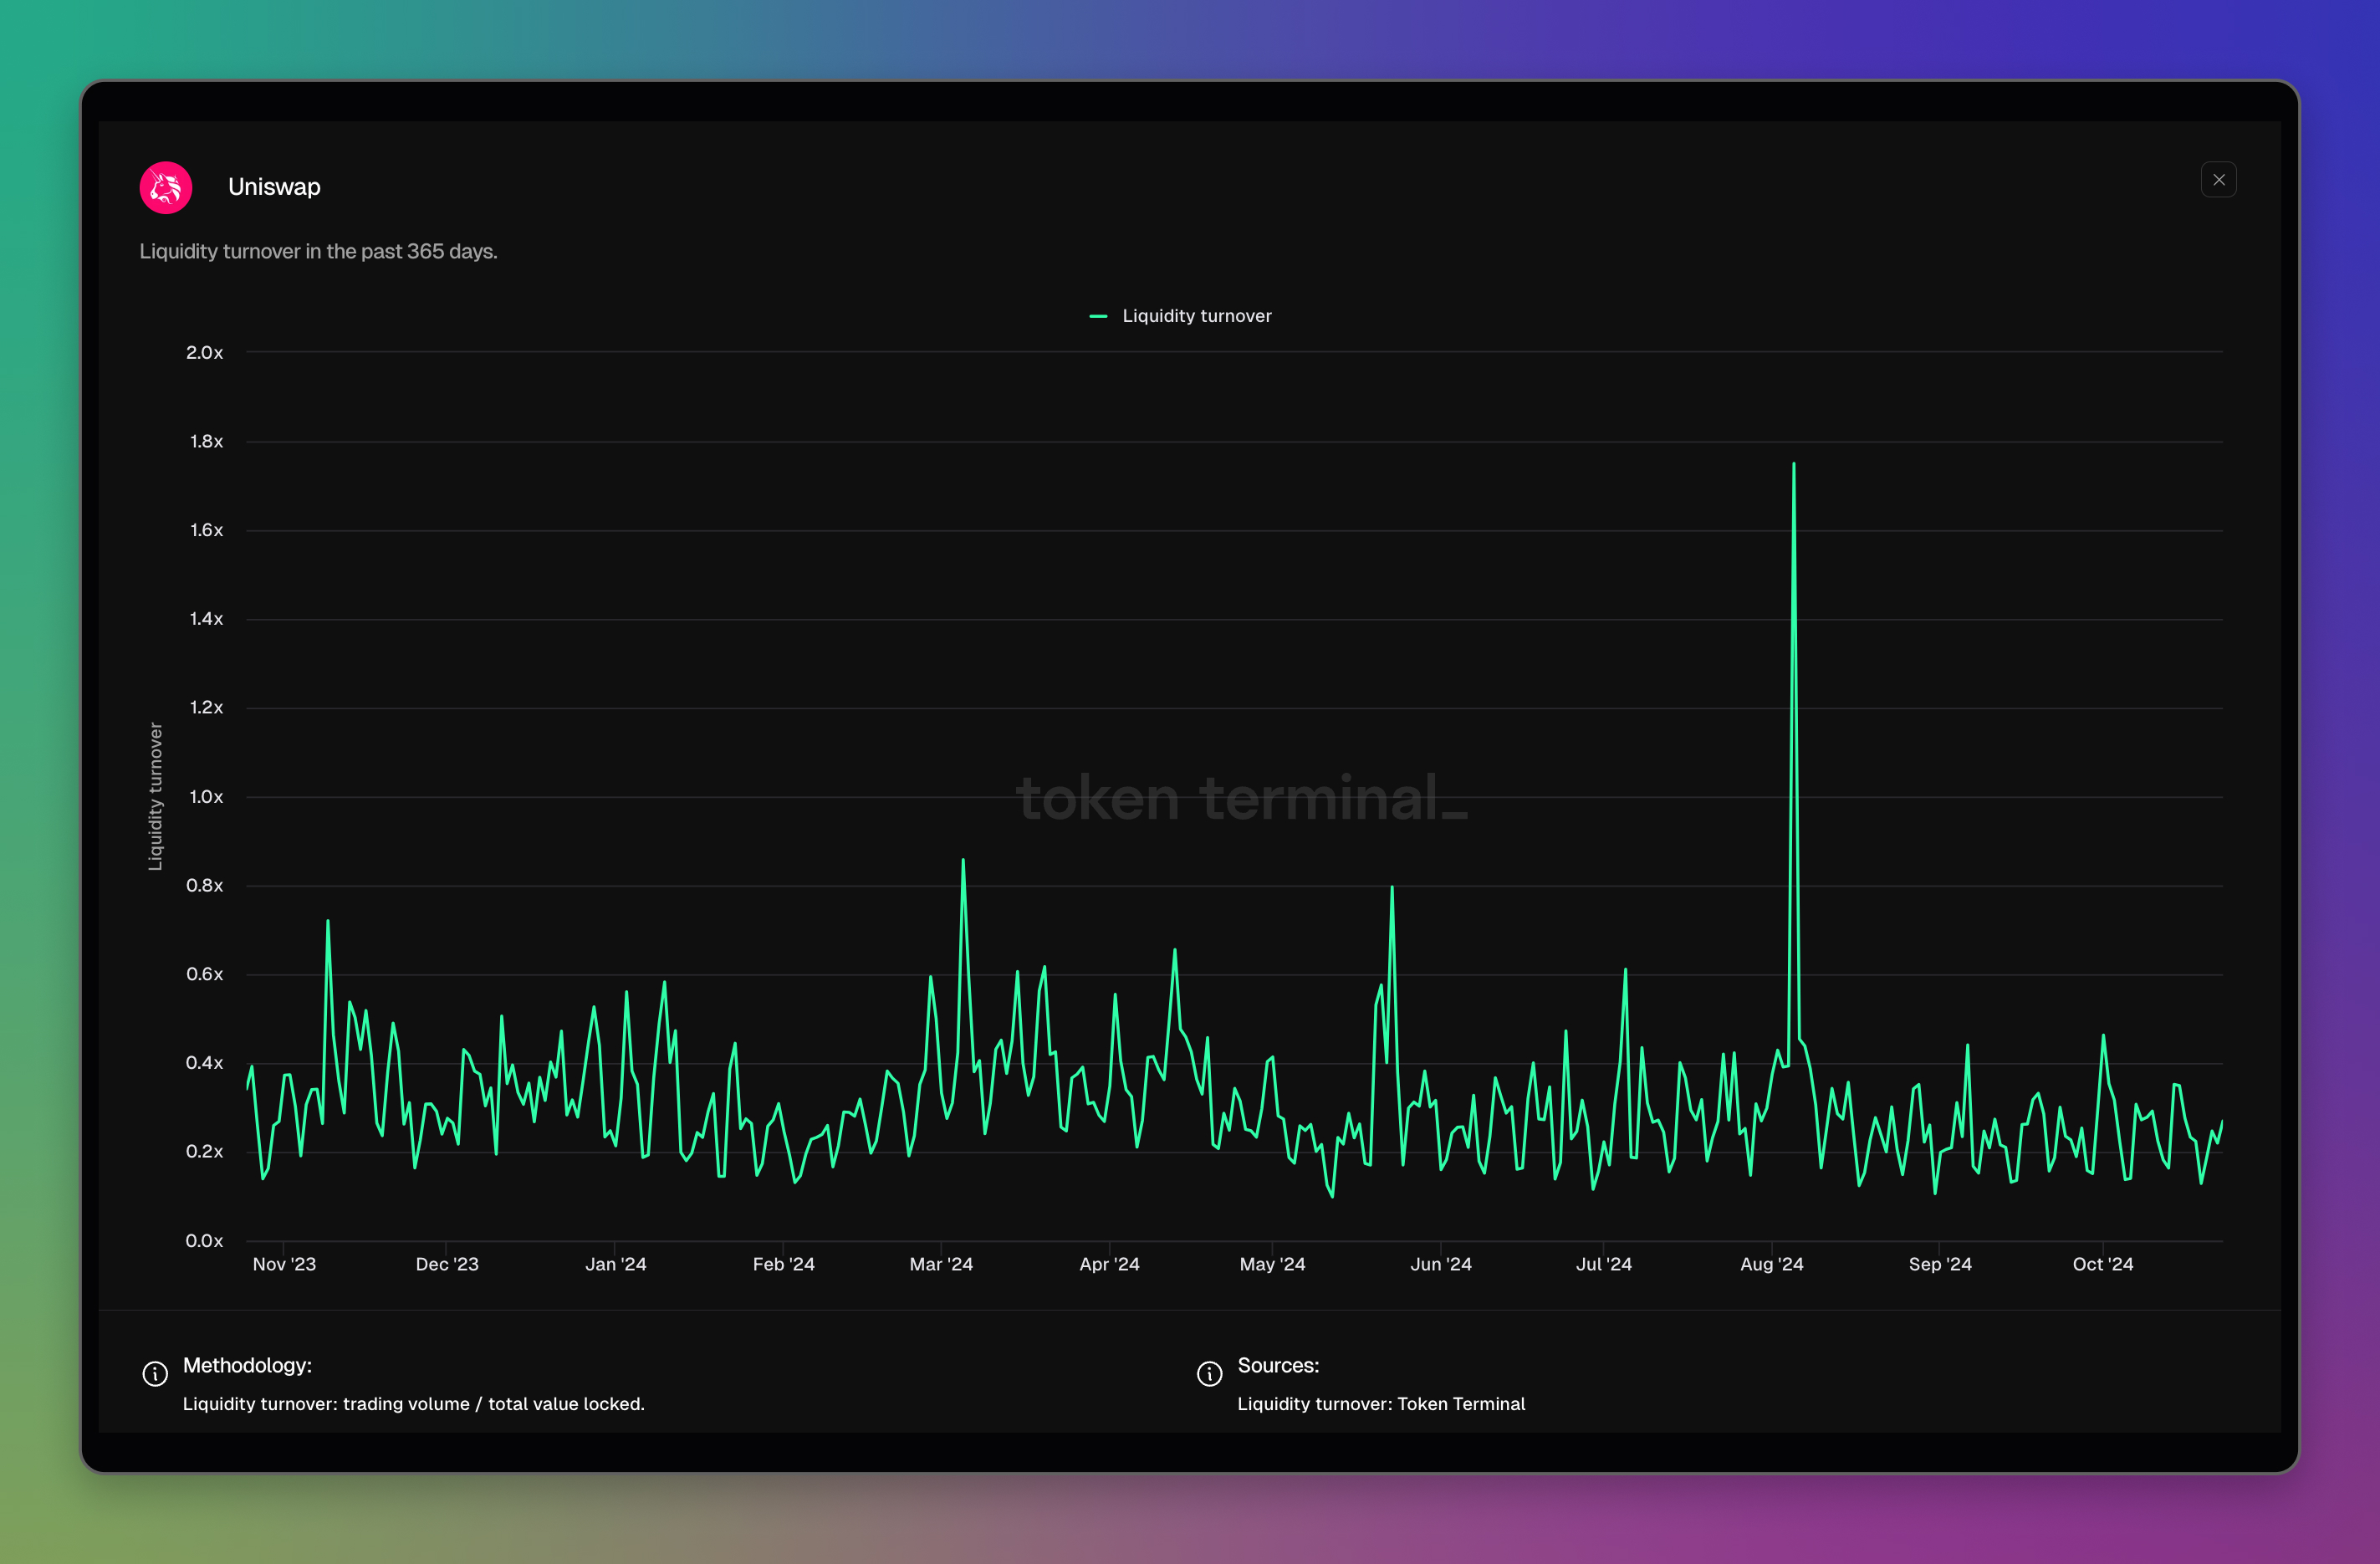
Uniswap dashboard: https://tokenterminal.com/terminal/projects/uniswap
Stablecoin transfer volume
What is this metric: Stablecoin transfer volume represents the total value of onchain transactions conducted with a specific stablecoin within a specified time period, measured in USD.
How it is calculated: The Stablecoin transfer volume aggregates the USD value of all onchain transfers made with the stablecoin during the specified time period. This data is purely sourced from onchain transactions.
Why do we show it: This metric is essential for understanding the level of activity and the market dynamics of the stablecoin. By measuring the total transfer volume, we gain insights into how actively the stablecoin is being used for transactions. This can indicate the stablecoin’s adoption and utilization in the broader cryptocurrency ecosystem. It helps in evaluating the stablecoin's role and effectiveness as a medium of exchange and as a component of digital economy liquidity.
Example:
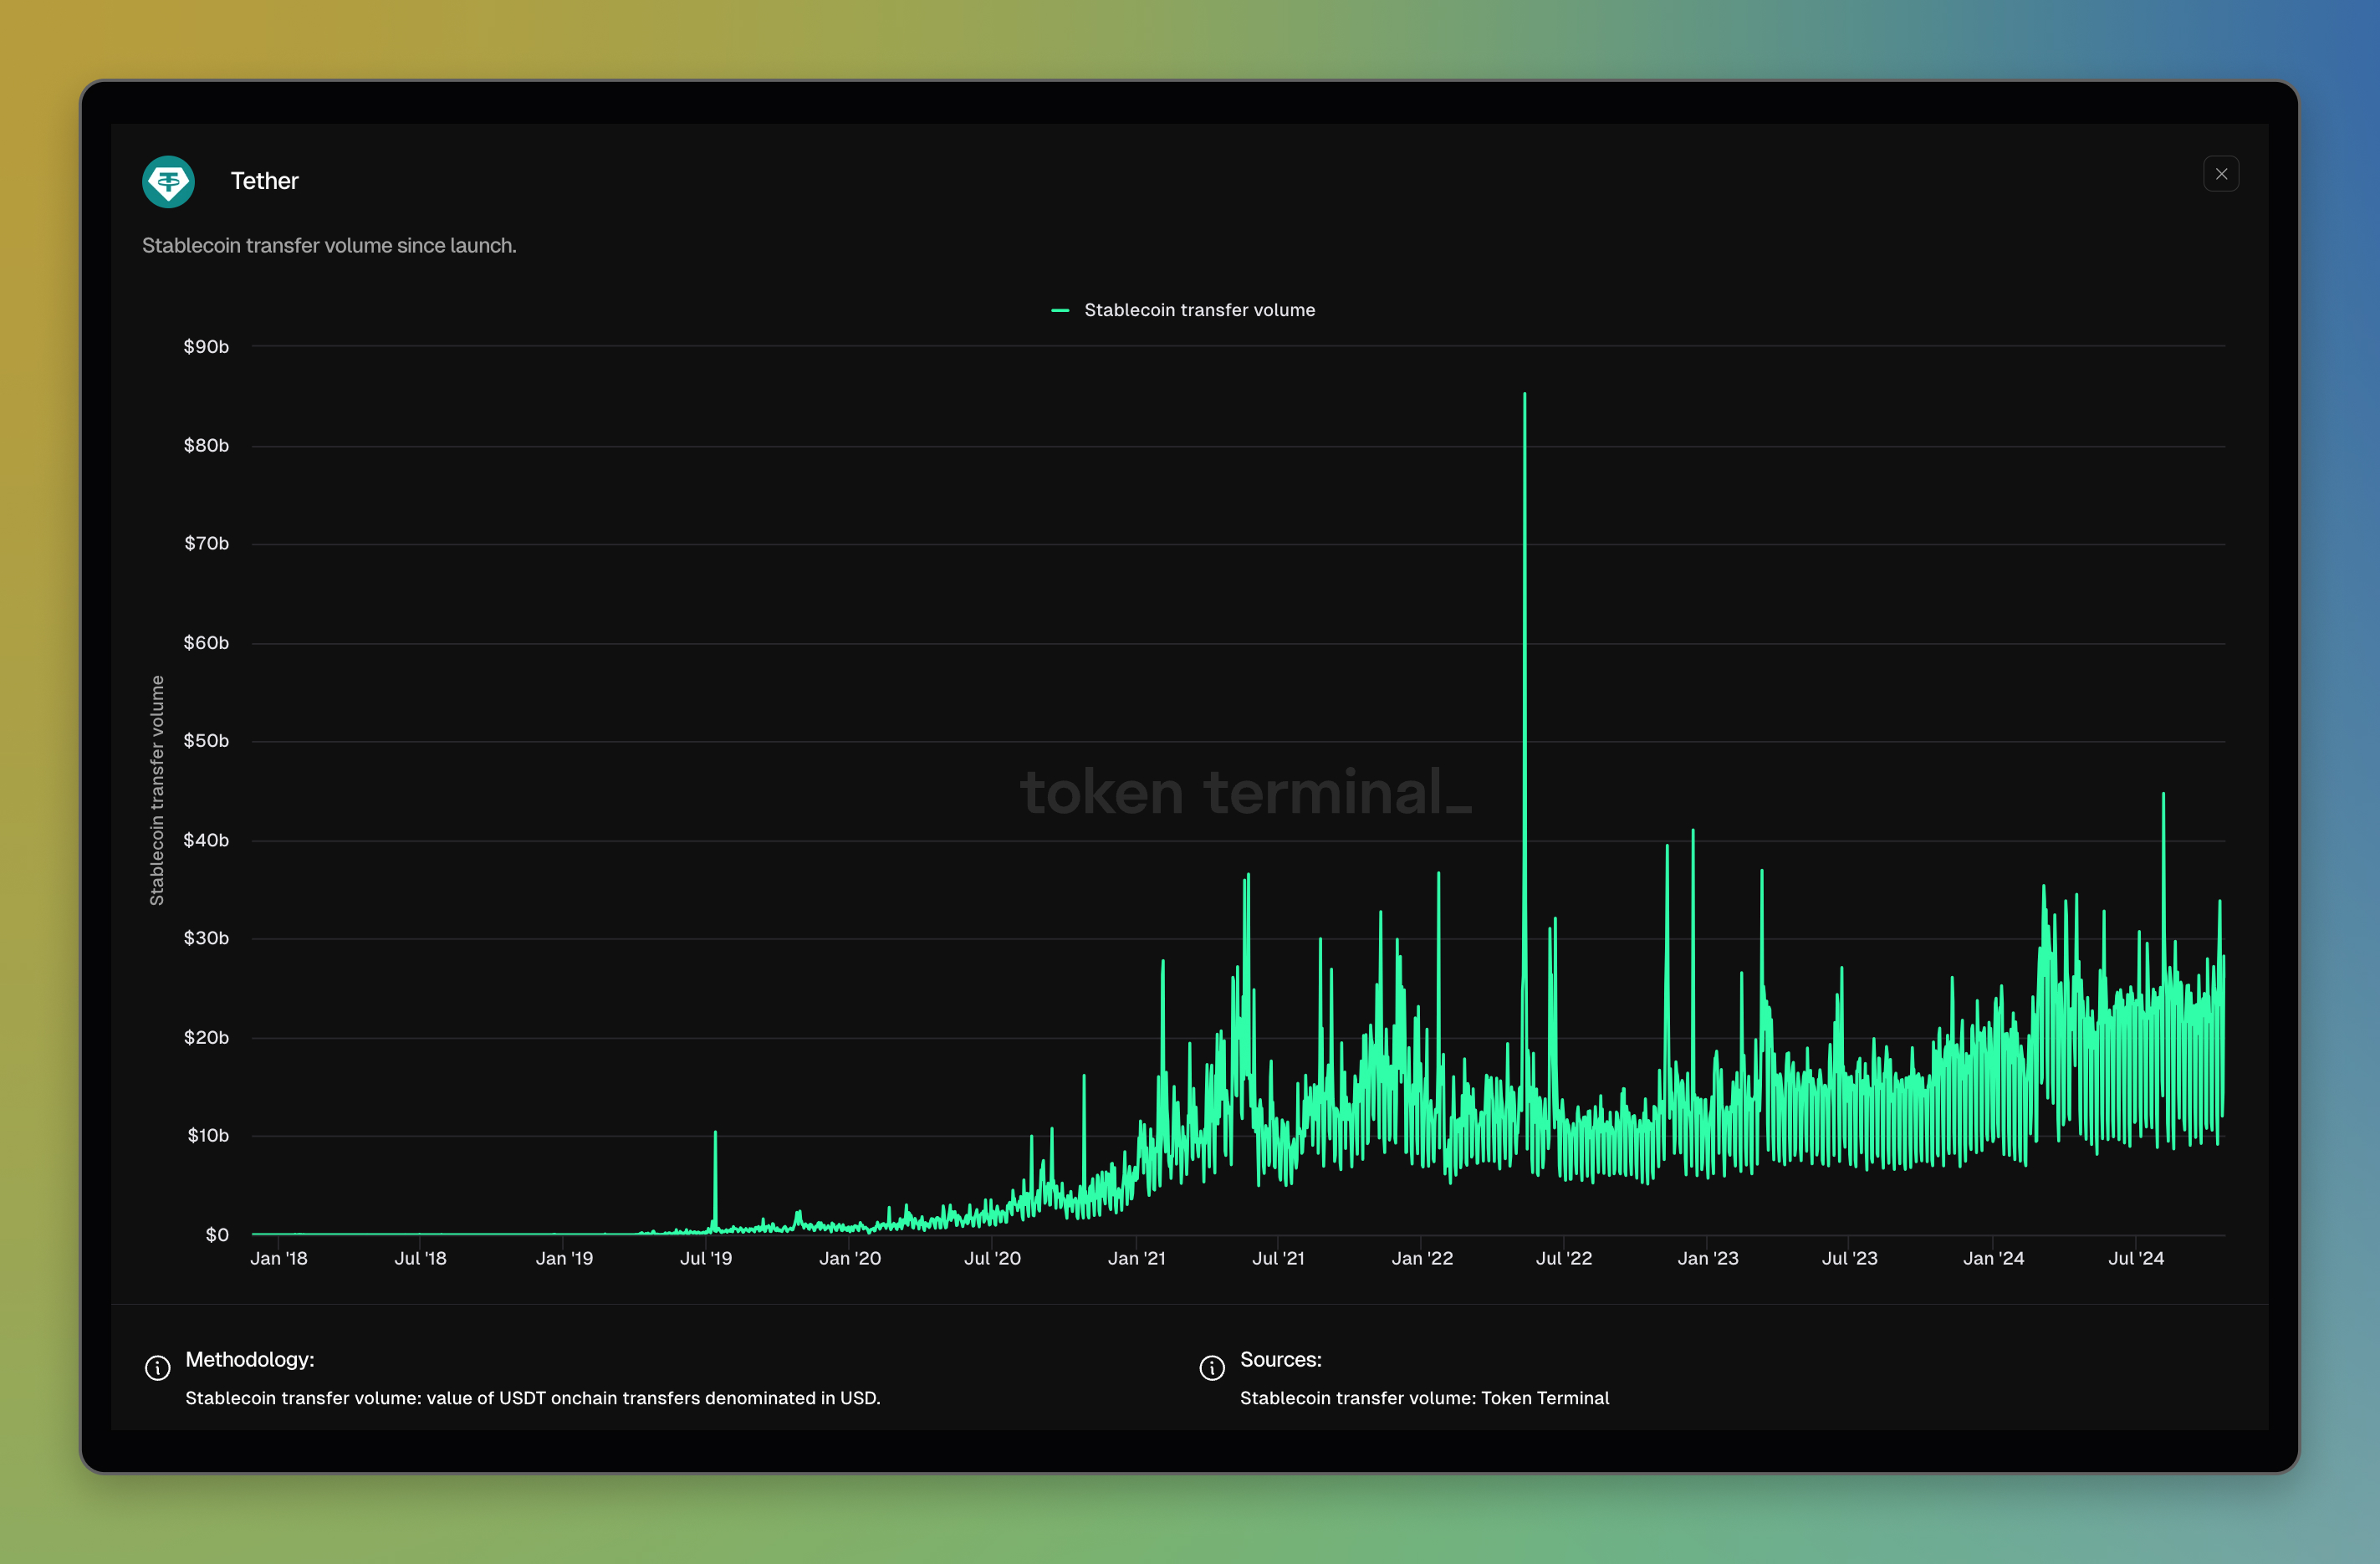
Tether dashboard: https://tokenterminal.com/terminal/projects/tether
Stablecoin holders
What is this metric: Stablecoin holders is a metric that counts the number of unique wallet addresses holding a token balance greater than 0 of the project’s stablecoin.
How it is calculated: The Stablecoin holders metric adds the number of unique wallet addresses that have a balance greater than zero of a stablecoin issued by the stablecoin issuer. If the issuer has multiple stablecoins, the aggregated values are summed. This data is purely sourced from onchain transactions.
Why do we show it: The Stablecoin holders metric is crucial for understanding the distribution and adoption level of the stablecoin. It provides a clearer picture of how widely and diversely the stablecoin is distributed among users, offering insights beyond mere circulation figures. Tracking the number of holders gives a direct measure of the stablecoin's user base and market penetration. This metric helps to assess whether the stablecoin is widely used by a large number of individuals or concentrated in the hands of a few large holders, thus aiding in understanding its primary uses in the market. Additionally, it serves as a foundation for further analytical work, such as assessing the average holdings per user and analyzing market trends.
Example:
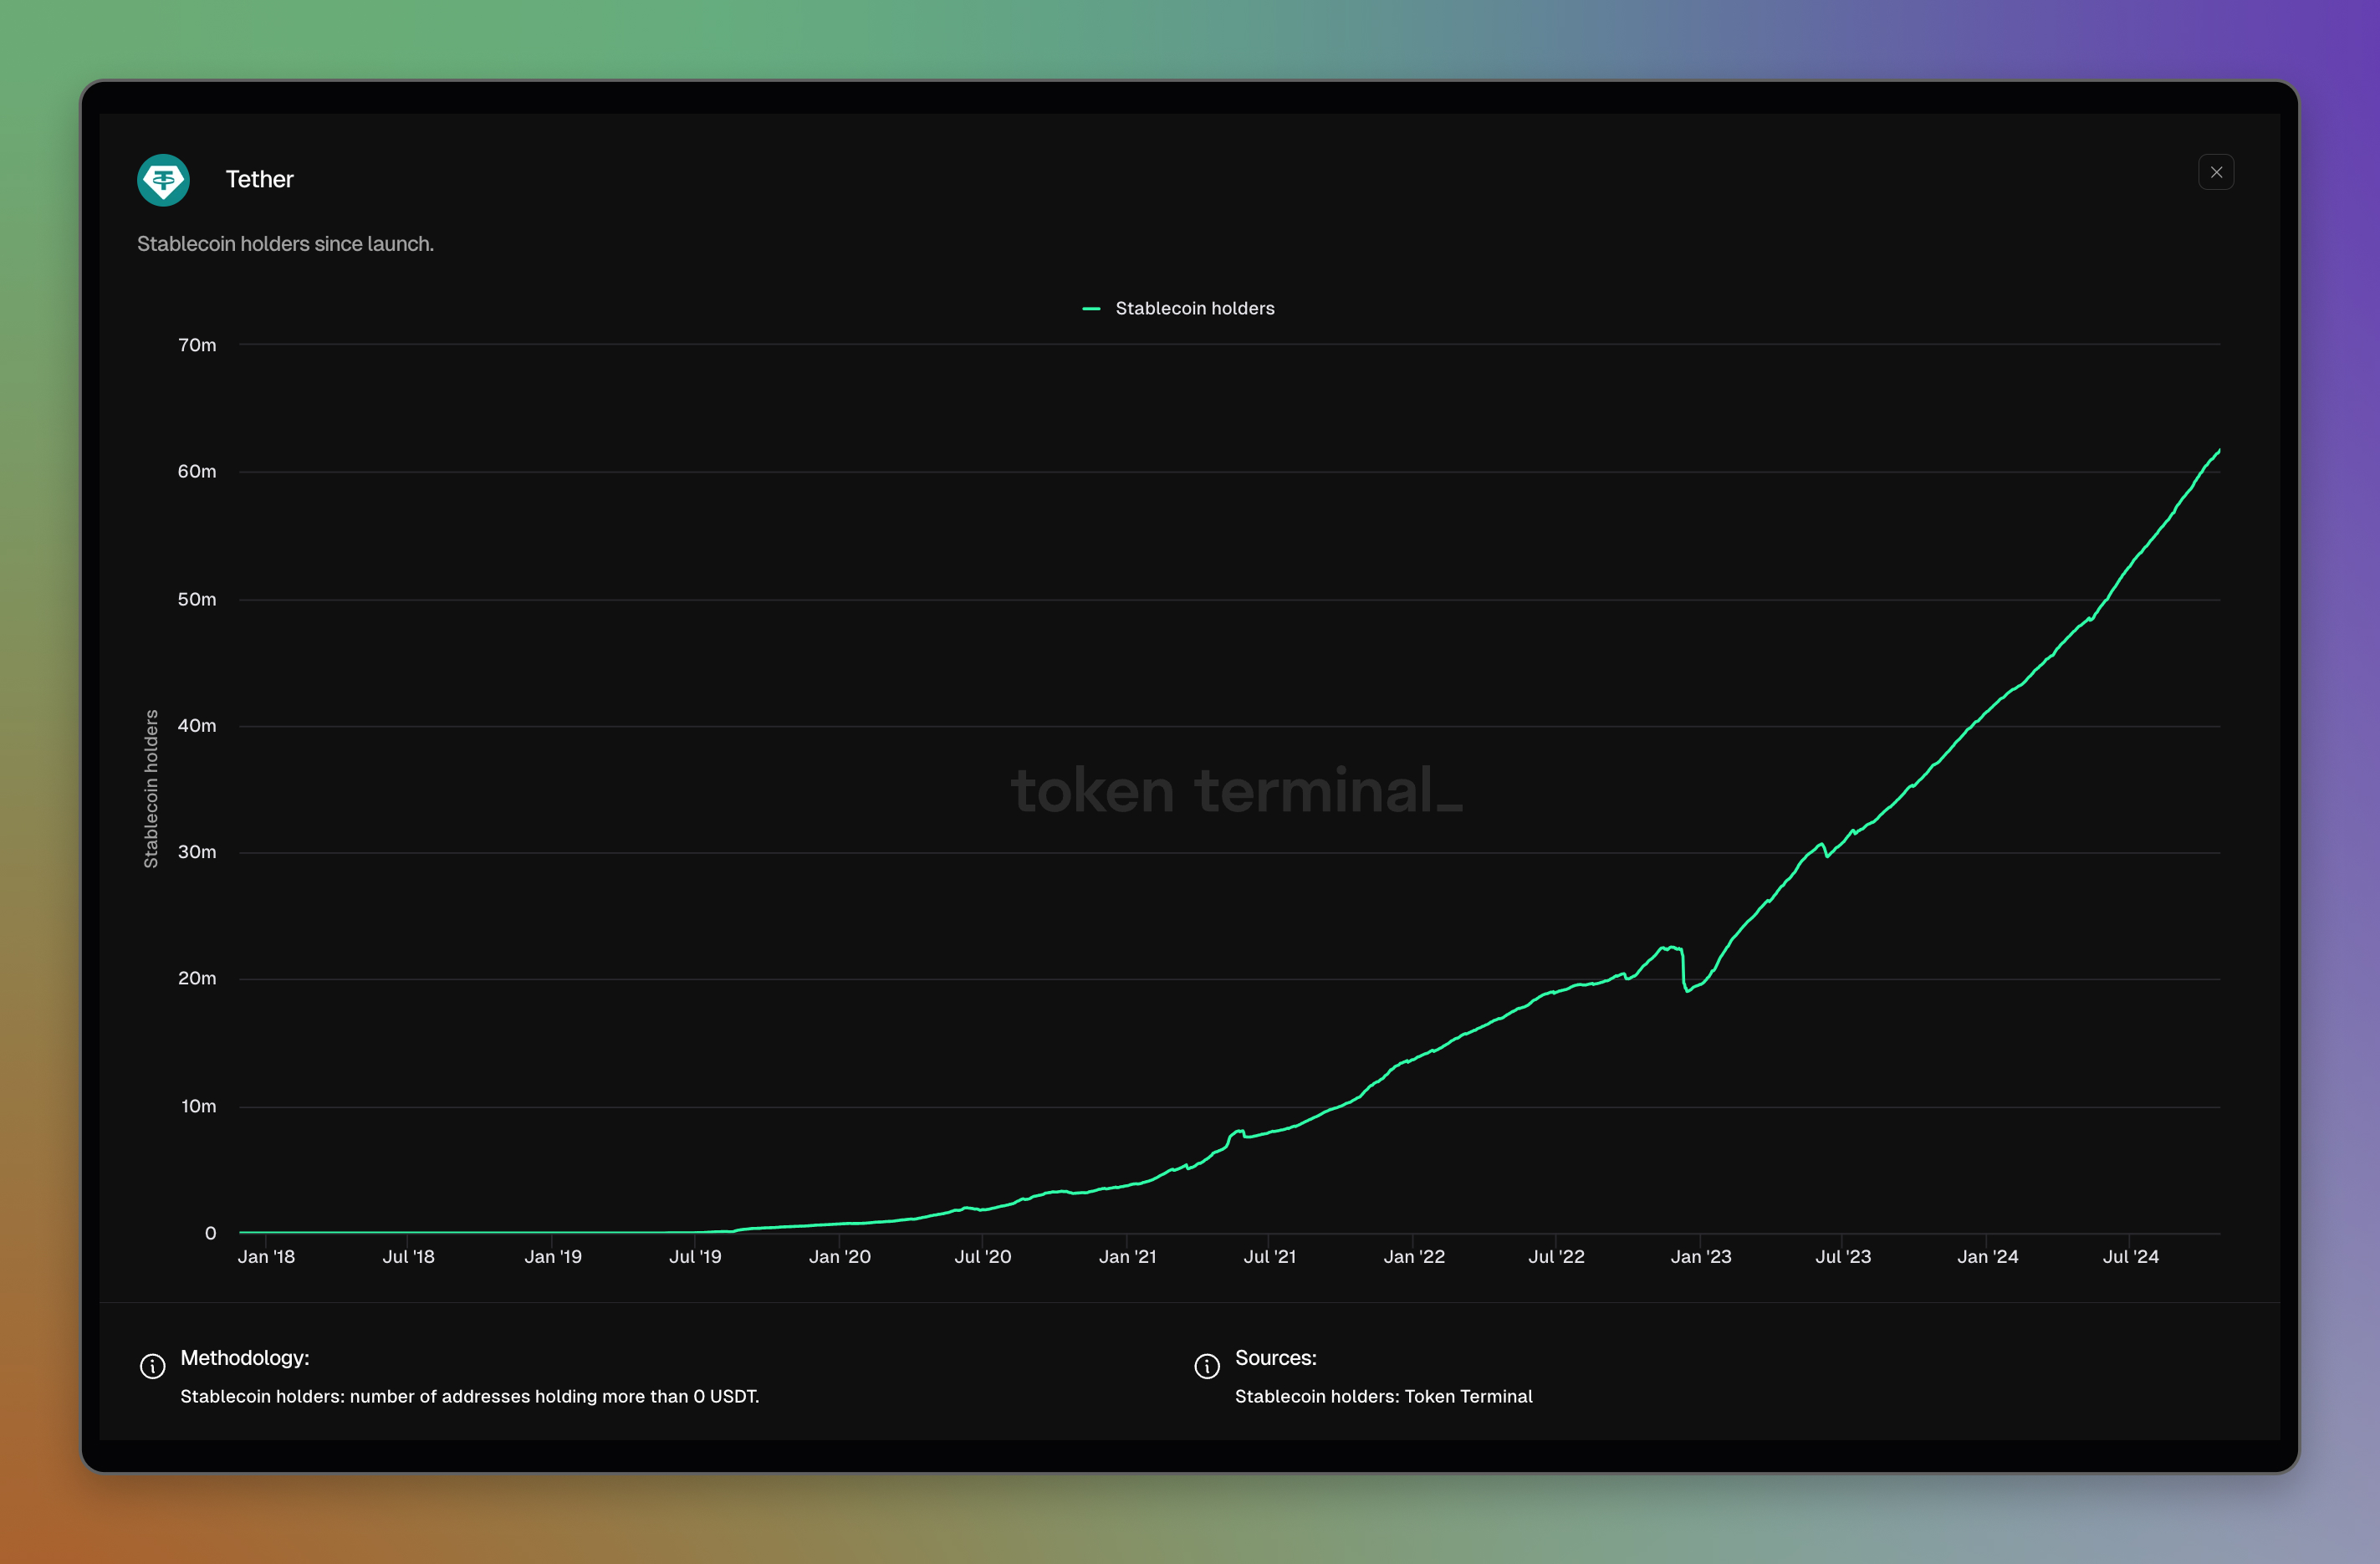
Tether dashboard: https://tokenterminal.com/terminal/projects/tether
Tradeable assets
What is this metric: Tradeable assets is a metric for DEXs (Decentralized Exchanges). It measures the number of tradable tokens in deployed liquidity pools. These tokens are divided into cohorts based on the liquidity contained by their pools.
How it is calculated: The calculation process involves determining the cumulative count of unique token addresses derived from trading pair creation events. Token liquidities are then summed up based on net deposits, and the tokens are categorized into liquidity cohorts.
Why do we show it: This metric shows the coverage and liquidity distribution of available tradable assets in the exchange.
Example:
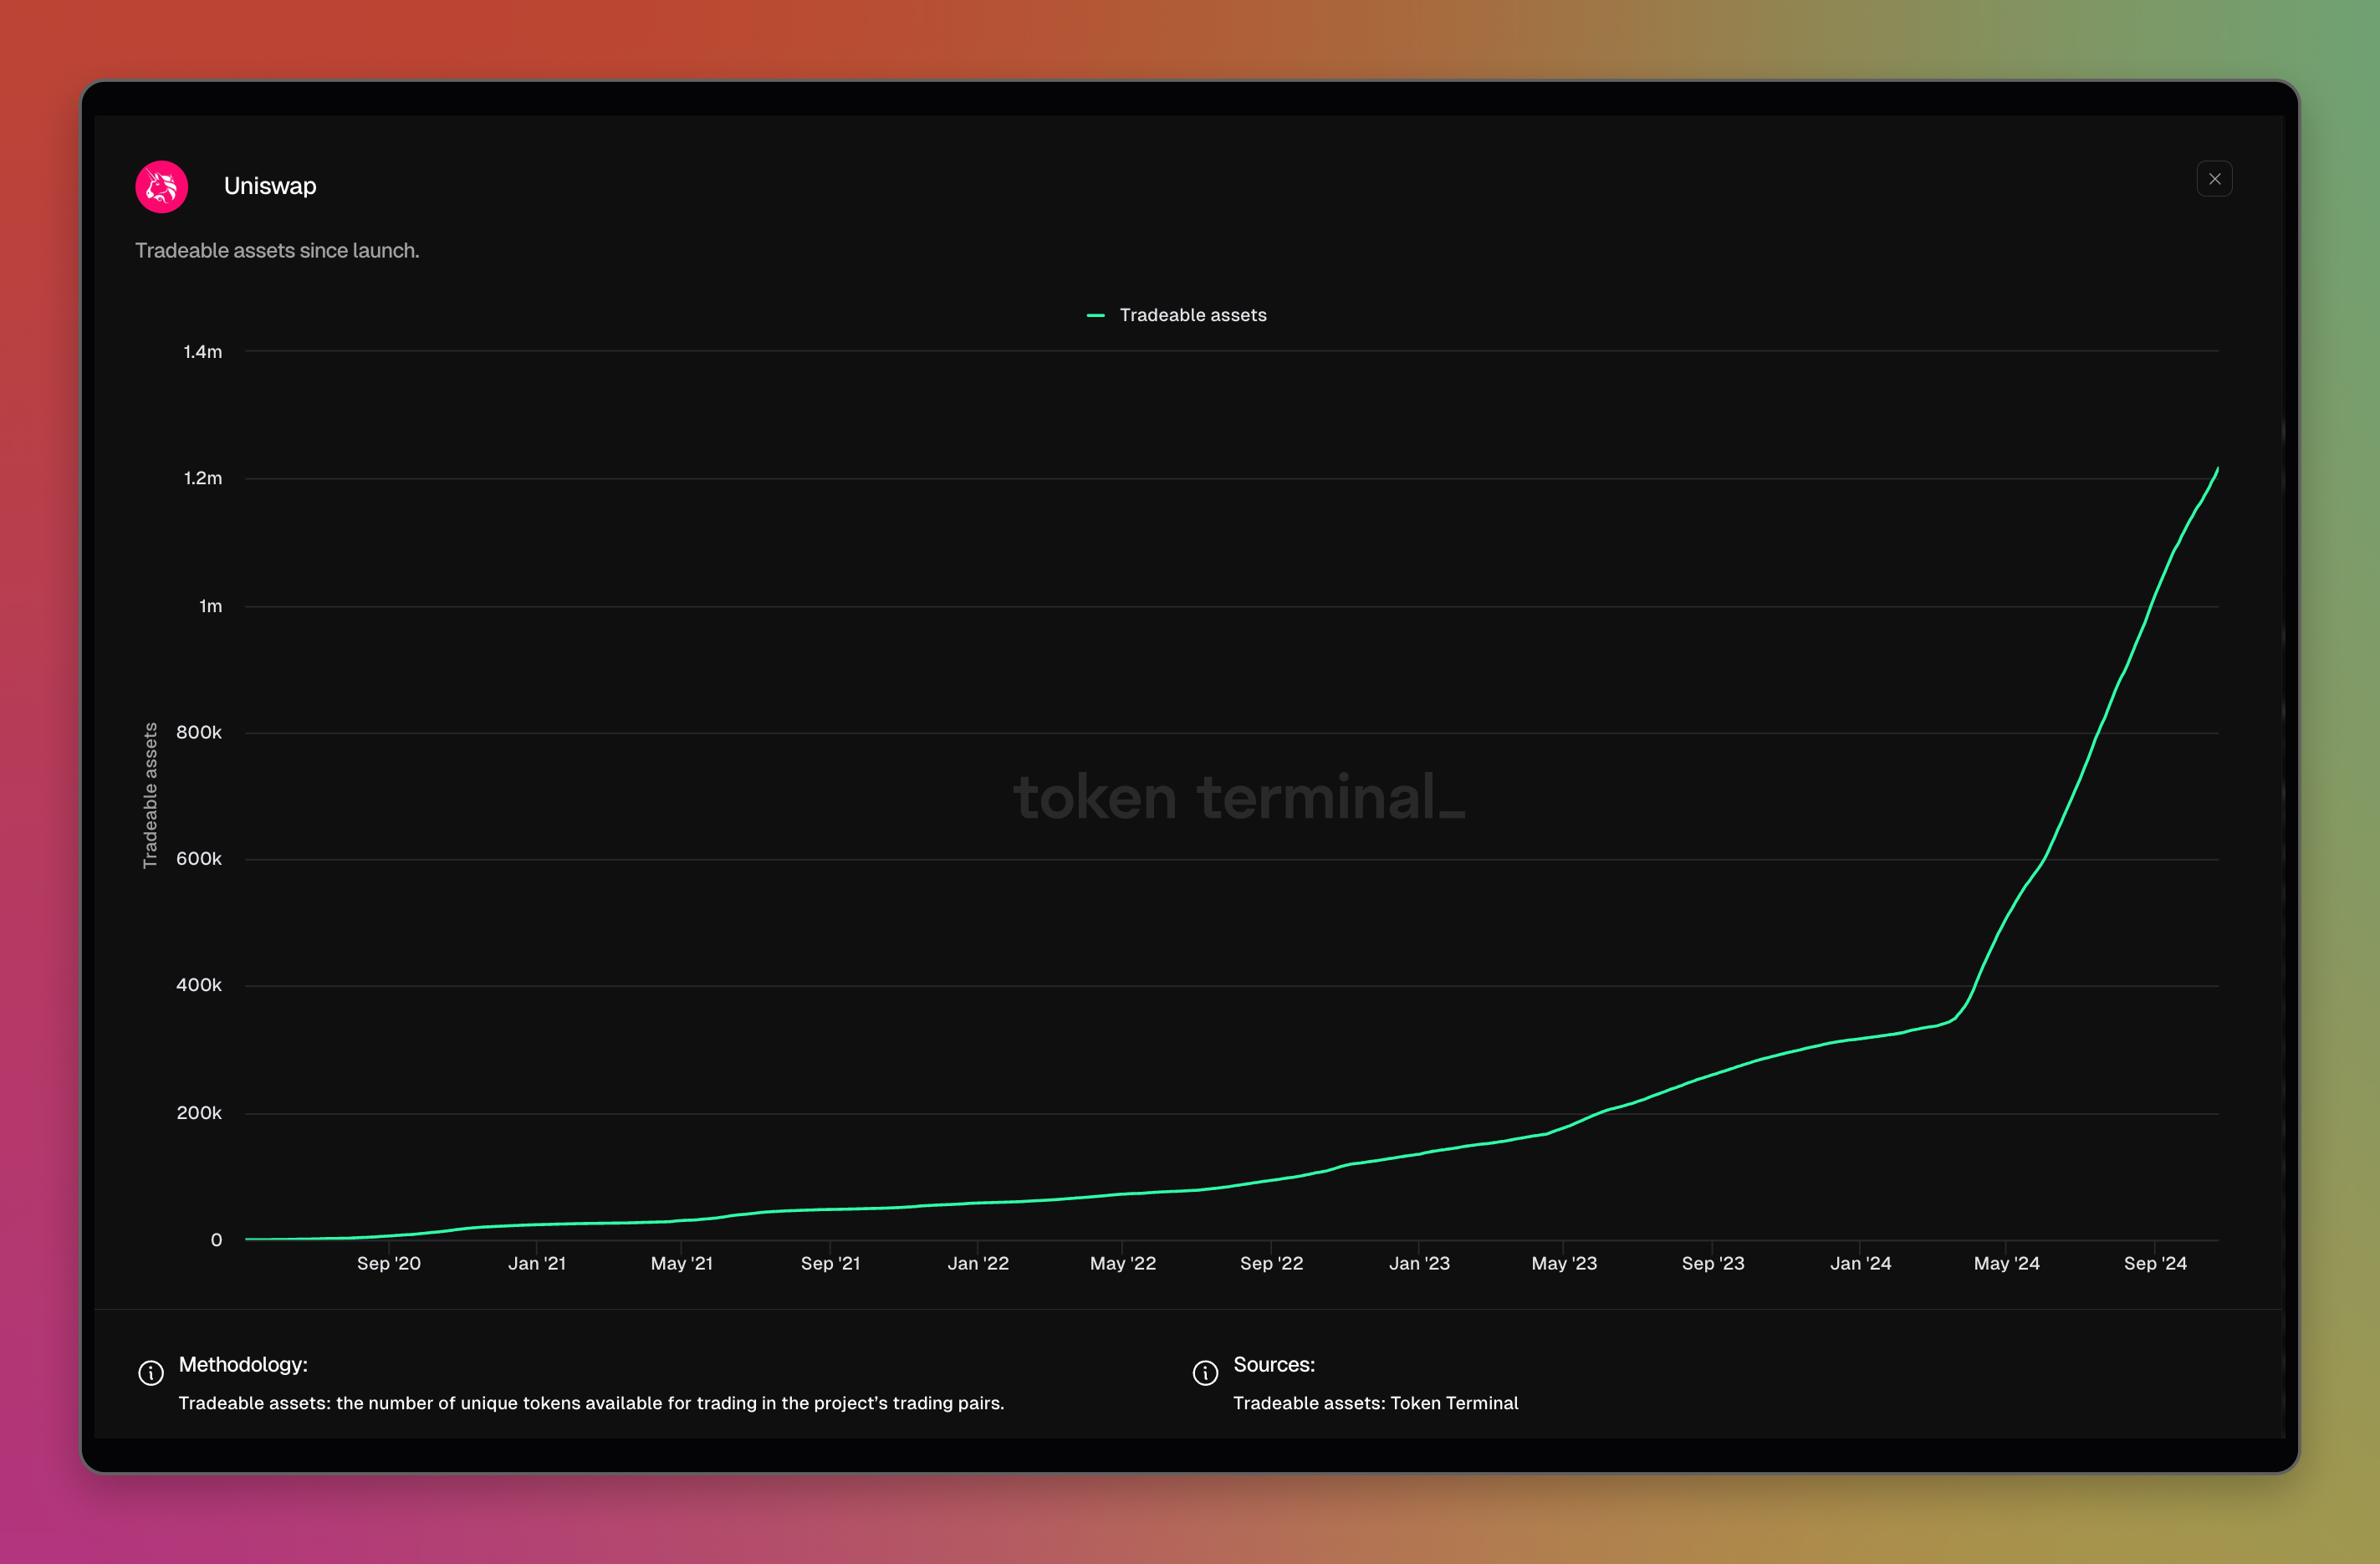
Uniswap dashboard: https://tokenterminal.com/terminal/projects/uniswap
Tradeable pairs
What is this metric: Tradable pairs is a metric for DEXs (Decentralized Exchanges). It measures the number of deployed trading pairs. These pairs are divided into cohorts based on liquidity.
How it is calculated: This metric is calculated by determining the cumulative count of unique account addresses from trading pair creation events. Pair liquidities are obtained from net deposits, and pairs are then categorized into liquidity cohorts for analysis.
Why do we show it: This metric illustrates the coverage and liquidity distribution of available tradable assets in the exchange.
Example:
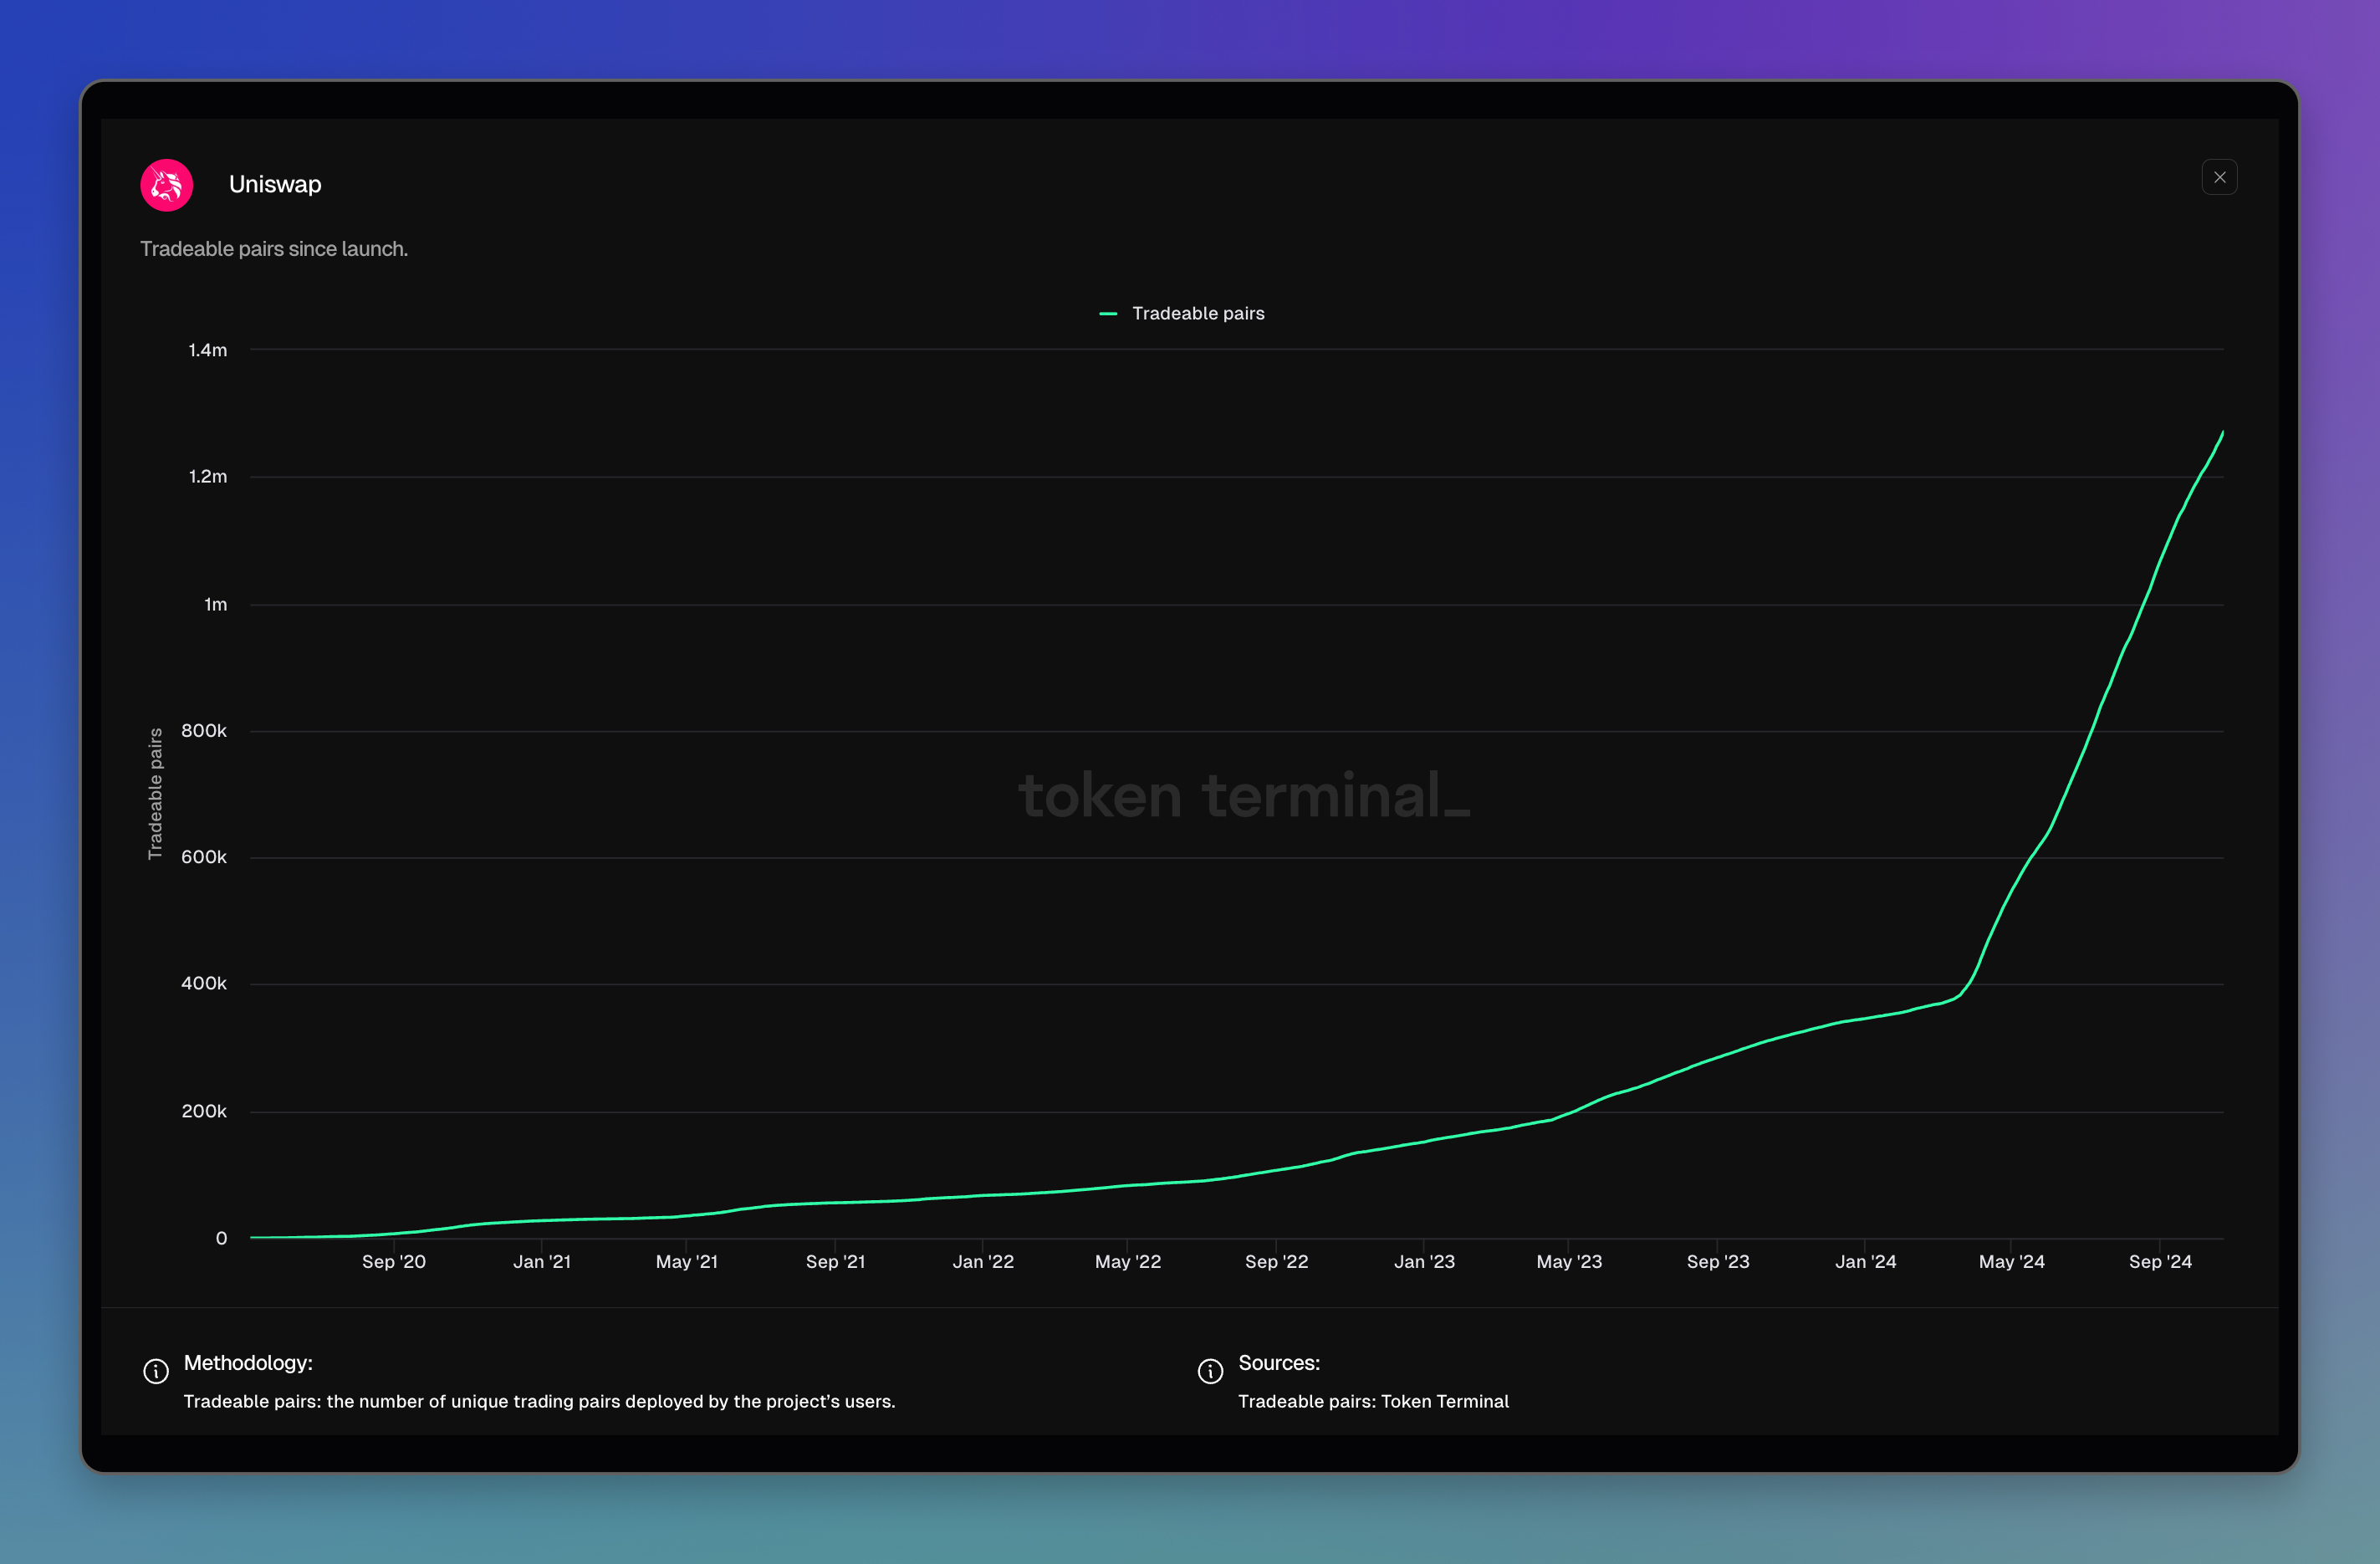
Uniswap dashboard: https://tokenterminal.com/terminal/projects/uniswap
Transaction count
What is this metric: Number of onchain transactions.
How it is calculated: Number of unique transactions on the protocol in a given time period.
Why do we show it: Highlights the magnitude of onchain activity on the protocol.
Example:
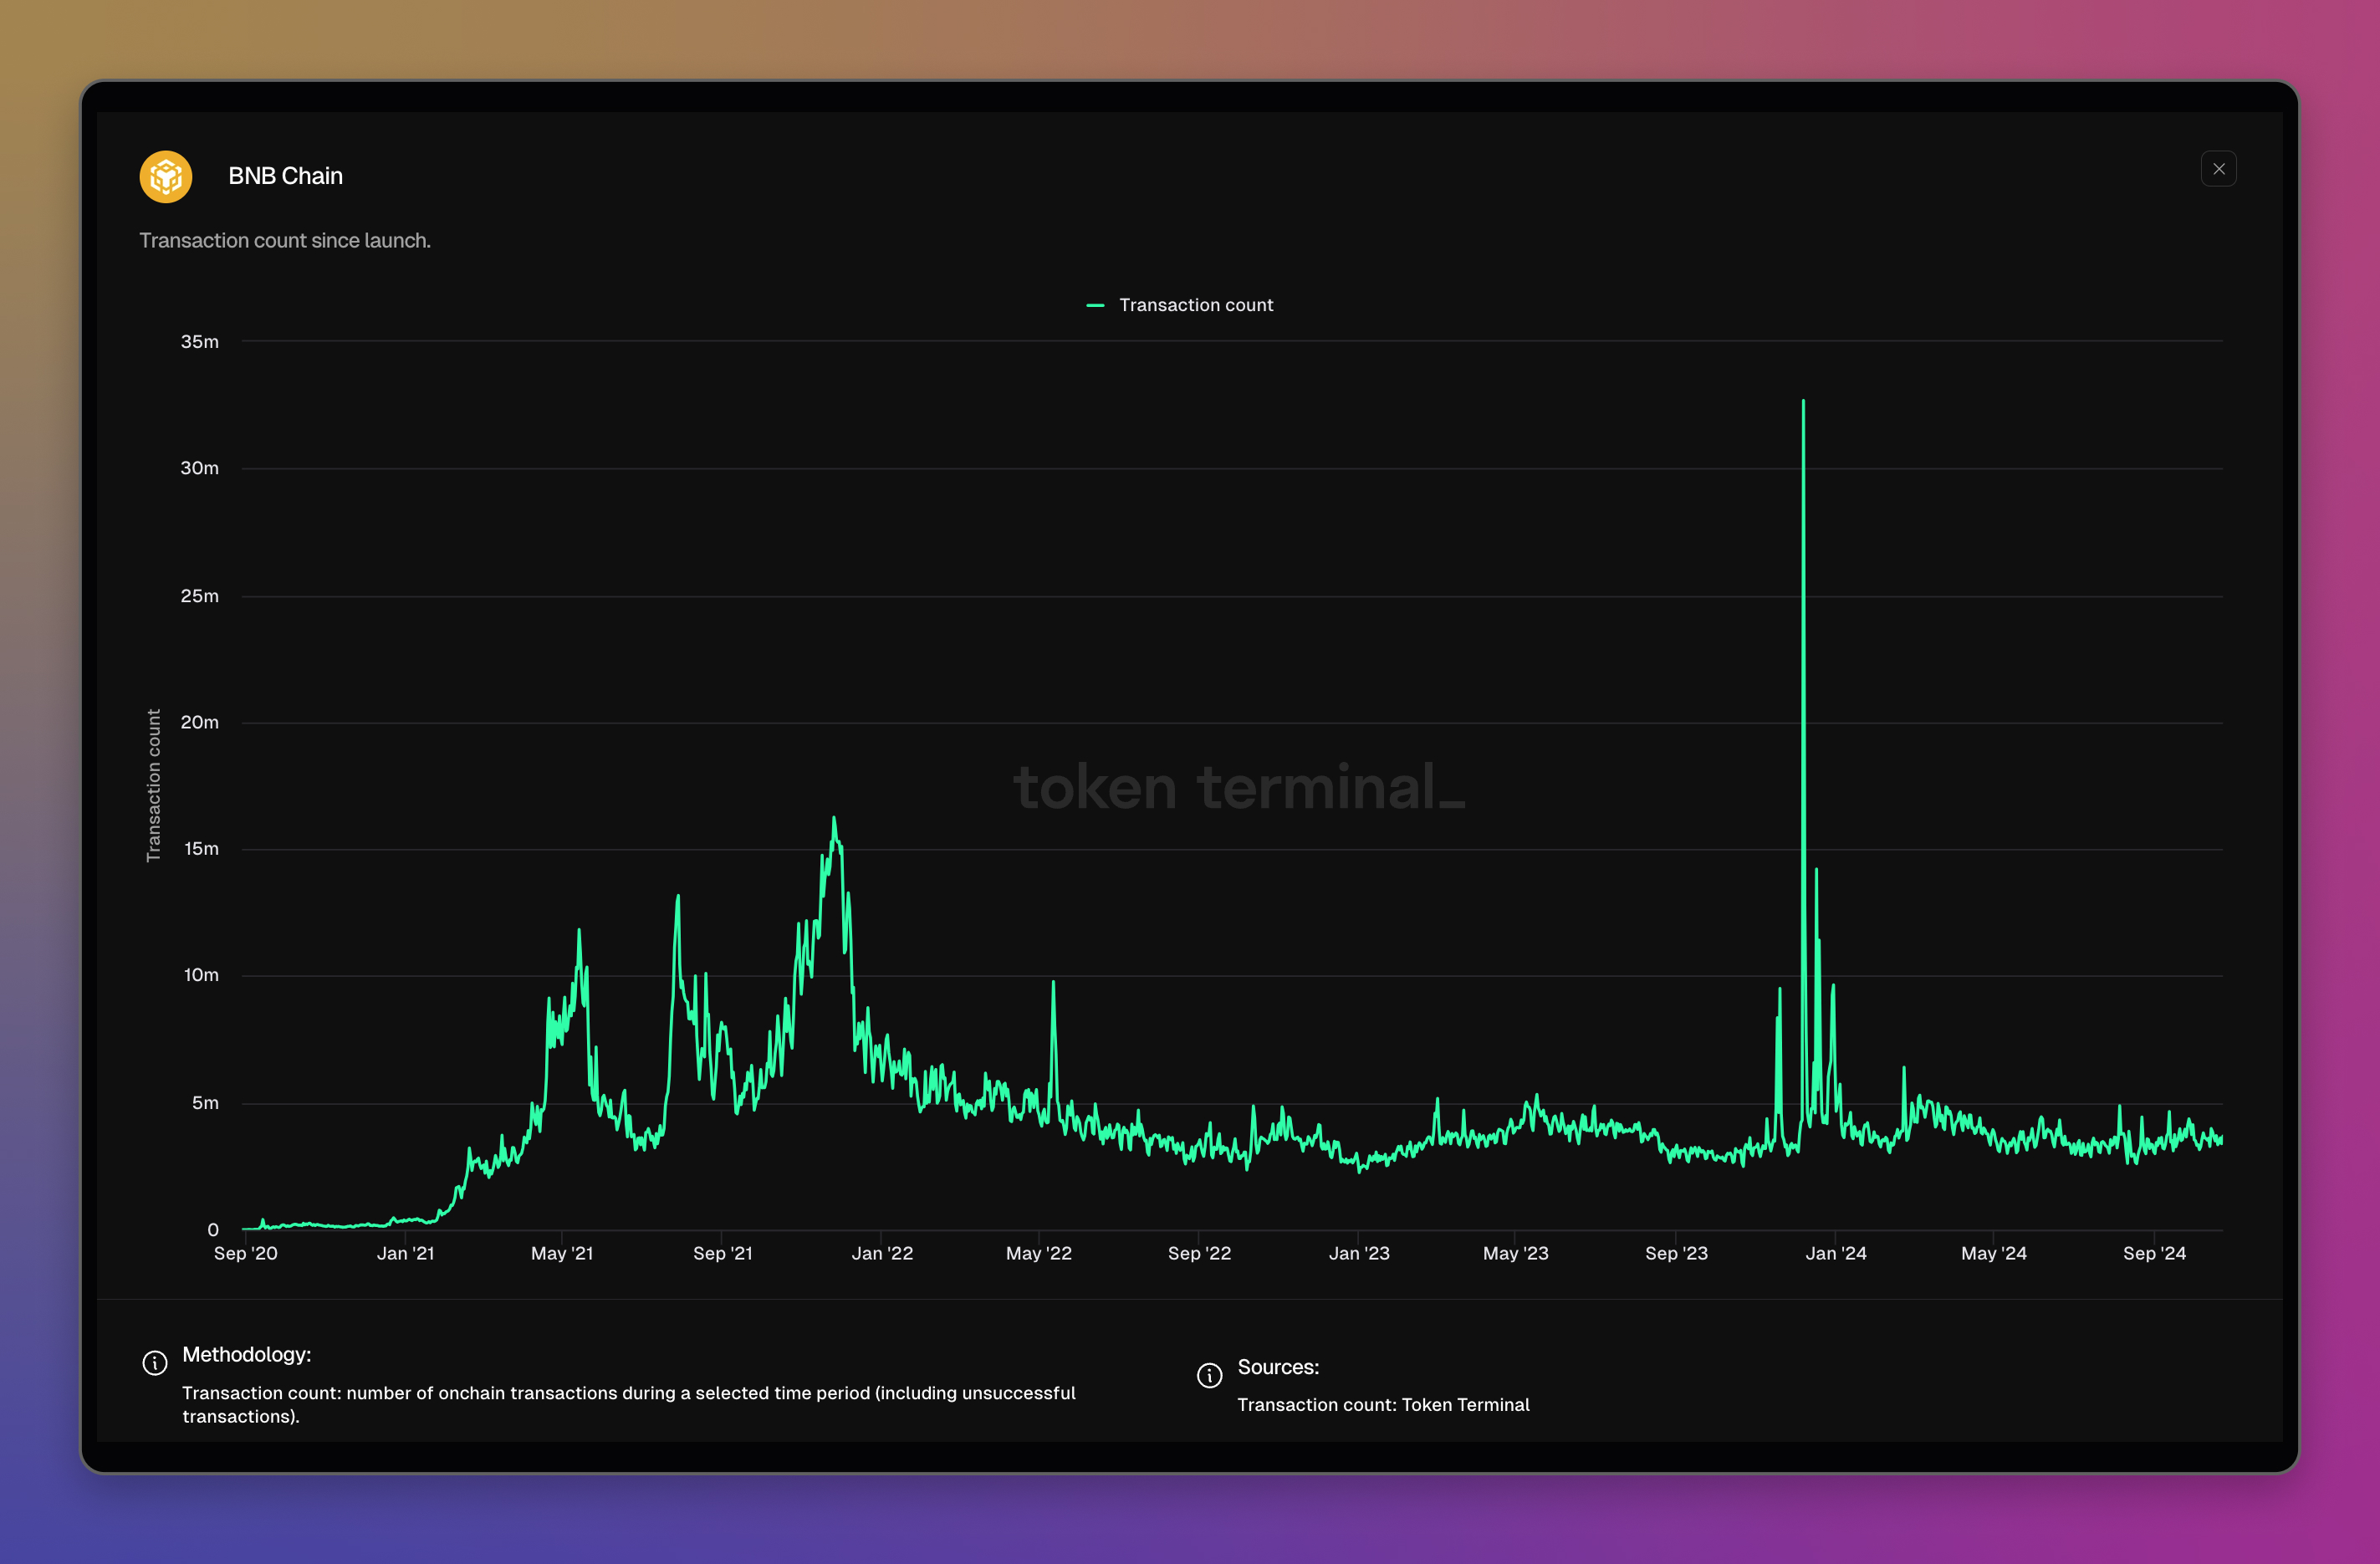
BNB Chain dashboard: https://tokenterminal.com/terminal/projects/binance-smart-chain
Transactions per second
What is this metric: Number of transactions added to blockchains, per second.
How it is calculated: We count the number of transactions added to a blockchain during a specified time period (e.g. a day) and divide it by the number of seconds elapsed during that period.
Why do we show it: An indicator of demand for the chain's block space. Showcases periods of high levels of onchain activity, or, on the other hand, low onchain activity, either organic or due to periods of degraded performance or other technical issues.
Example:
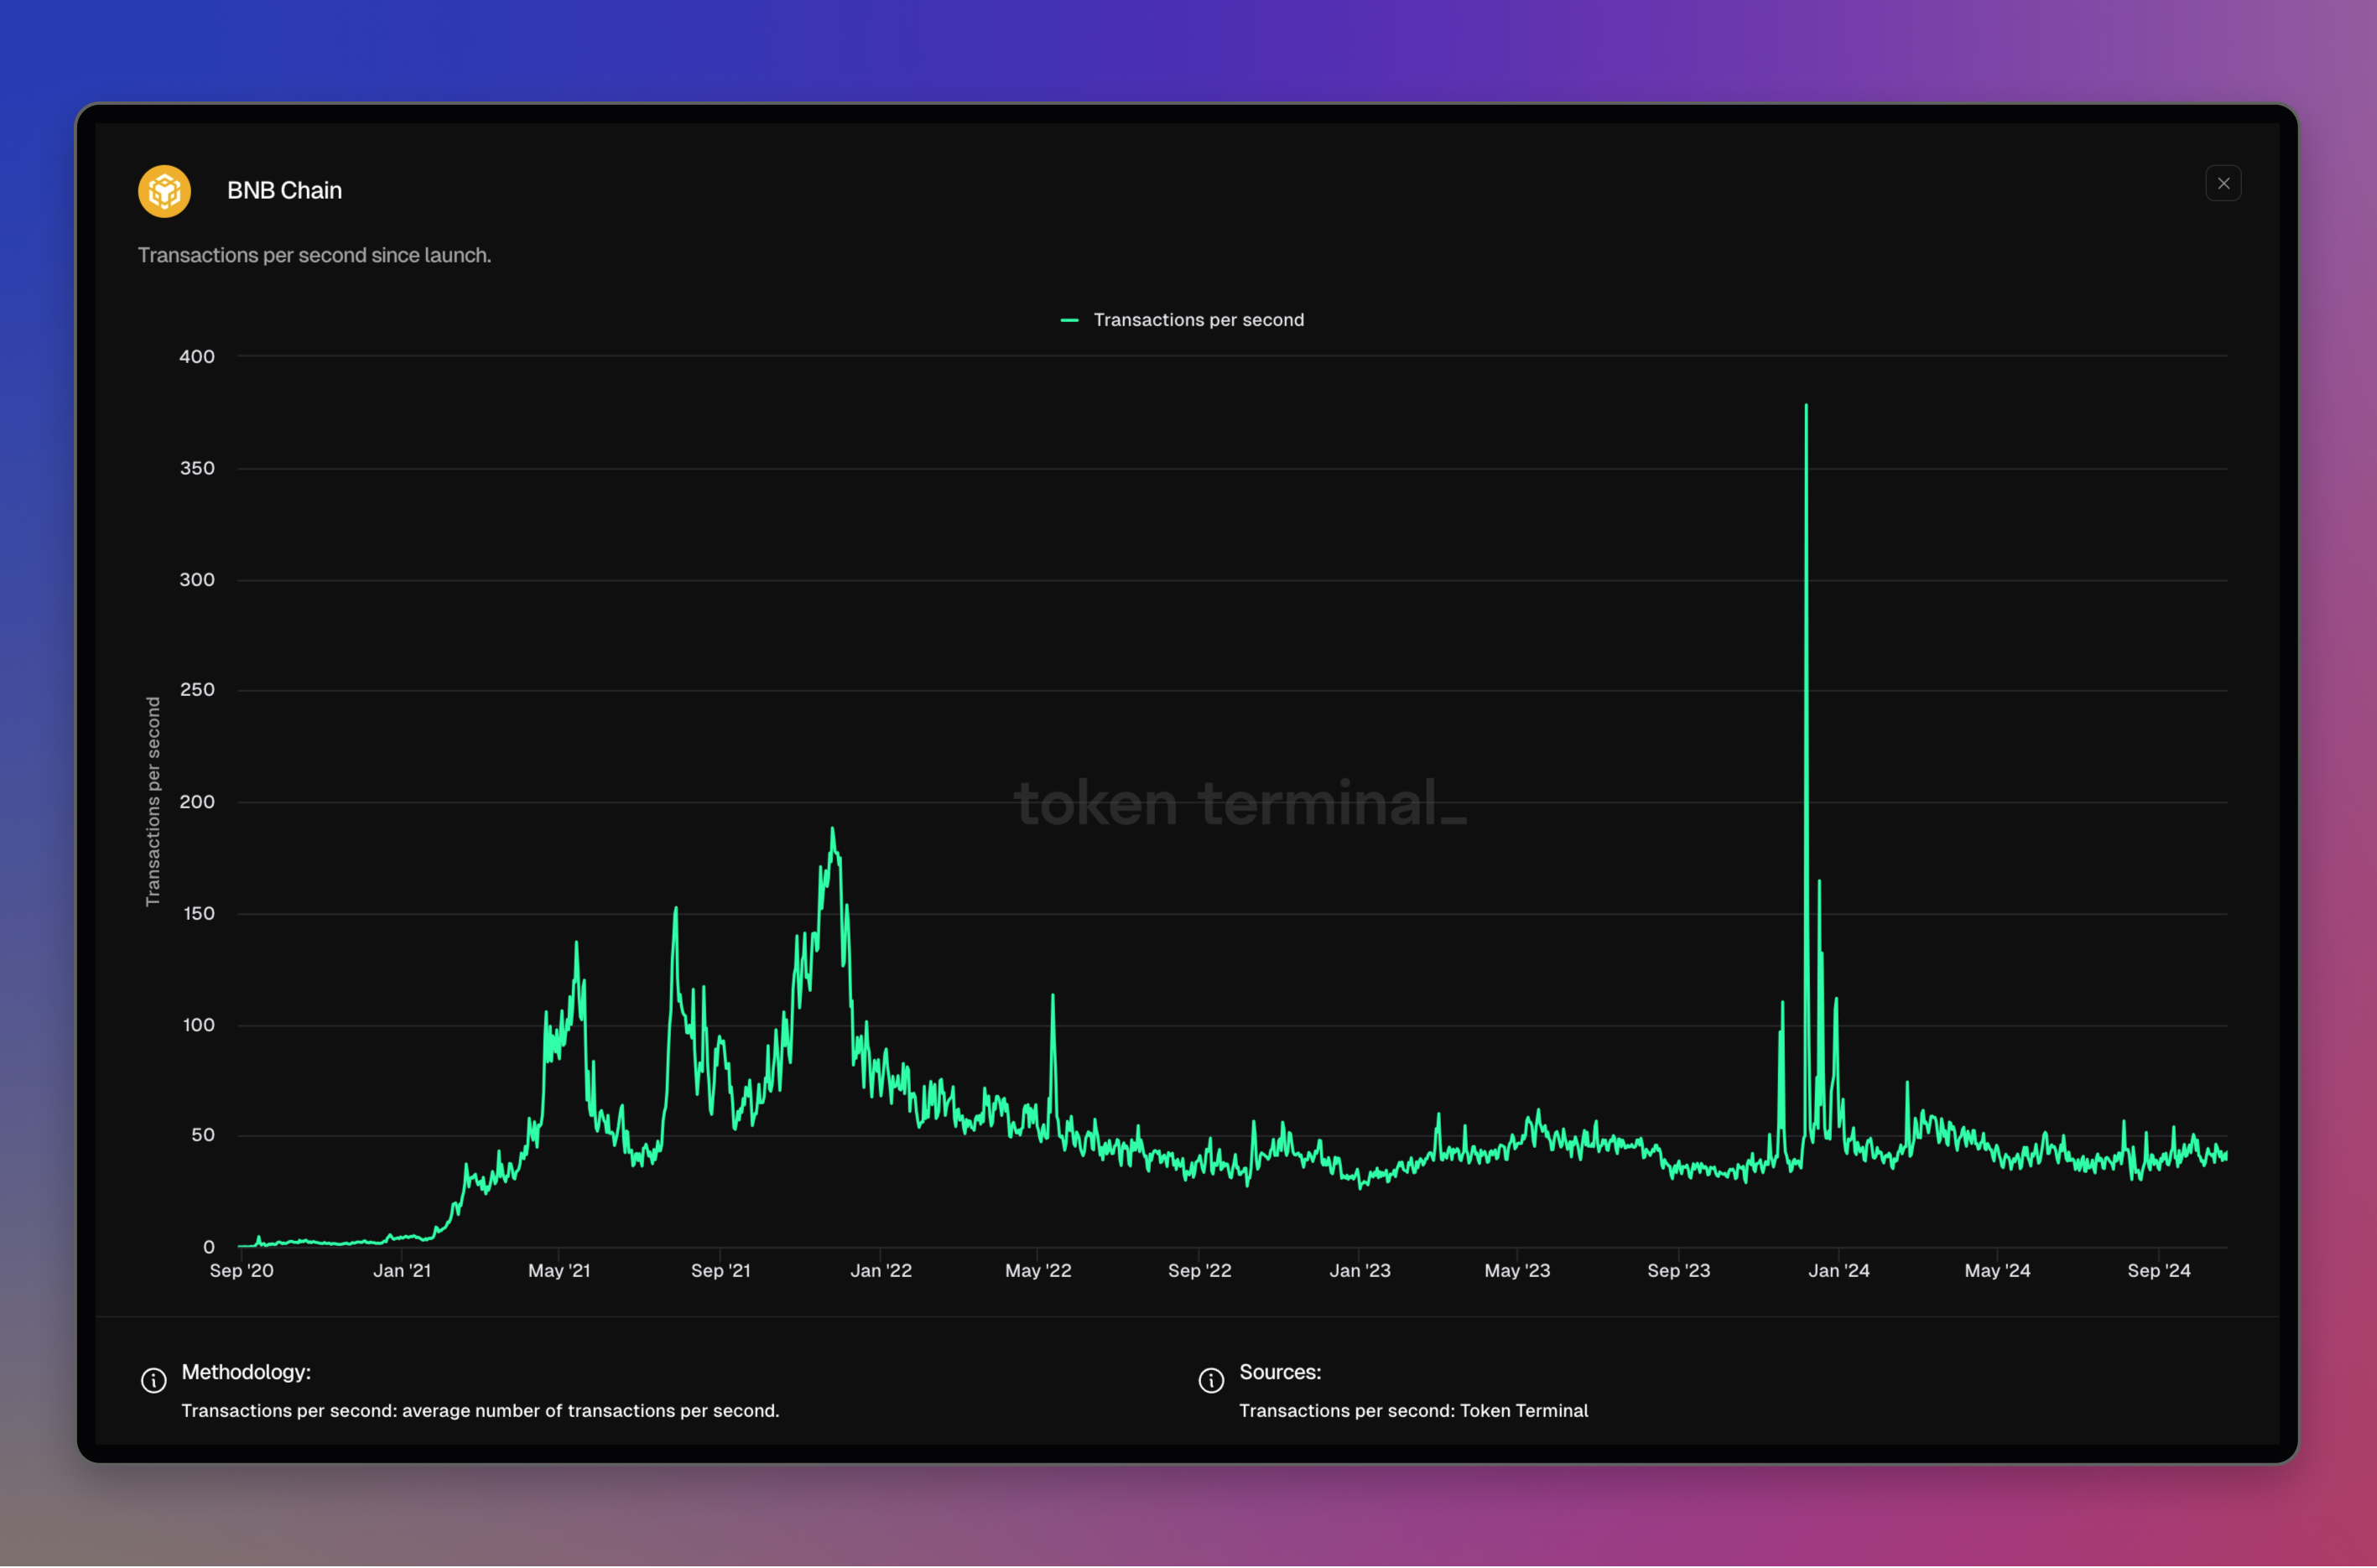
BNB Chain dashboard: https://tokenterminal.com/terminal/projects/binance-smart-chain
Updated 3 months ago