Dashboards
Easily track data across projects and metrics all in one place.
Dashboards allow you to create a single place to track your best ideas. Whether you're sharing dashboards with your audience or tracking your best ideas with your team, dashboards give you the full power of data on Token Terminal in a powerful, no-code tool.
Creating Dashboards
To create a dashboard, navigate to the Dashboard page in Studio. Click the "Create New" button in the upper right corner of the table to get started with creating your first dashboard.

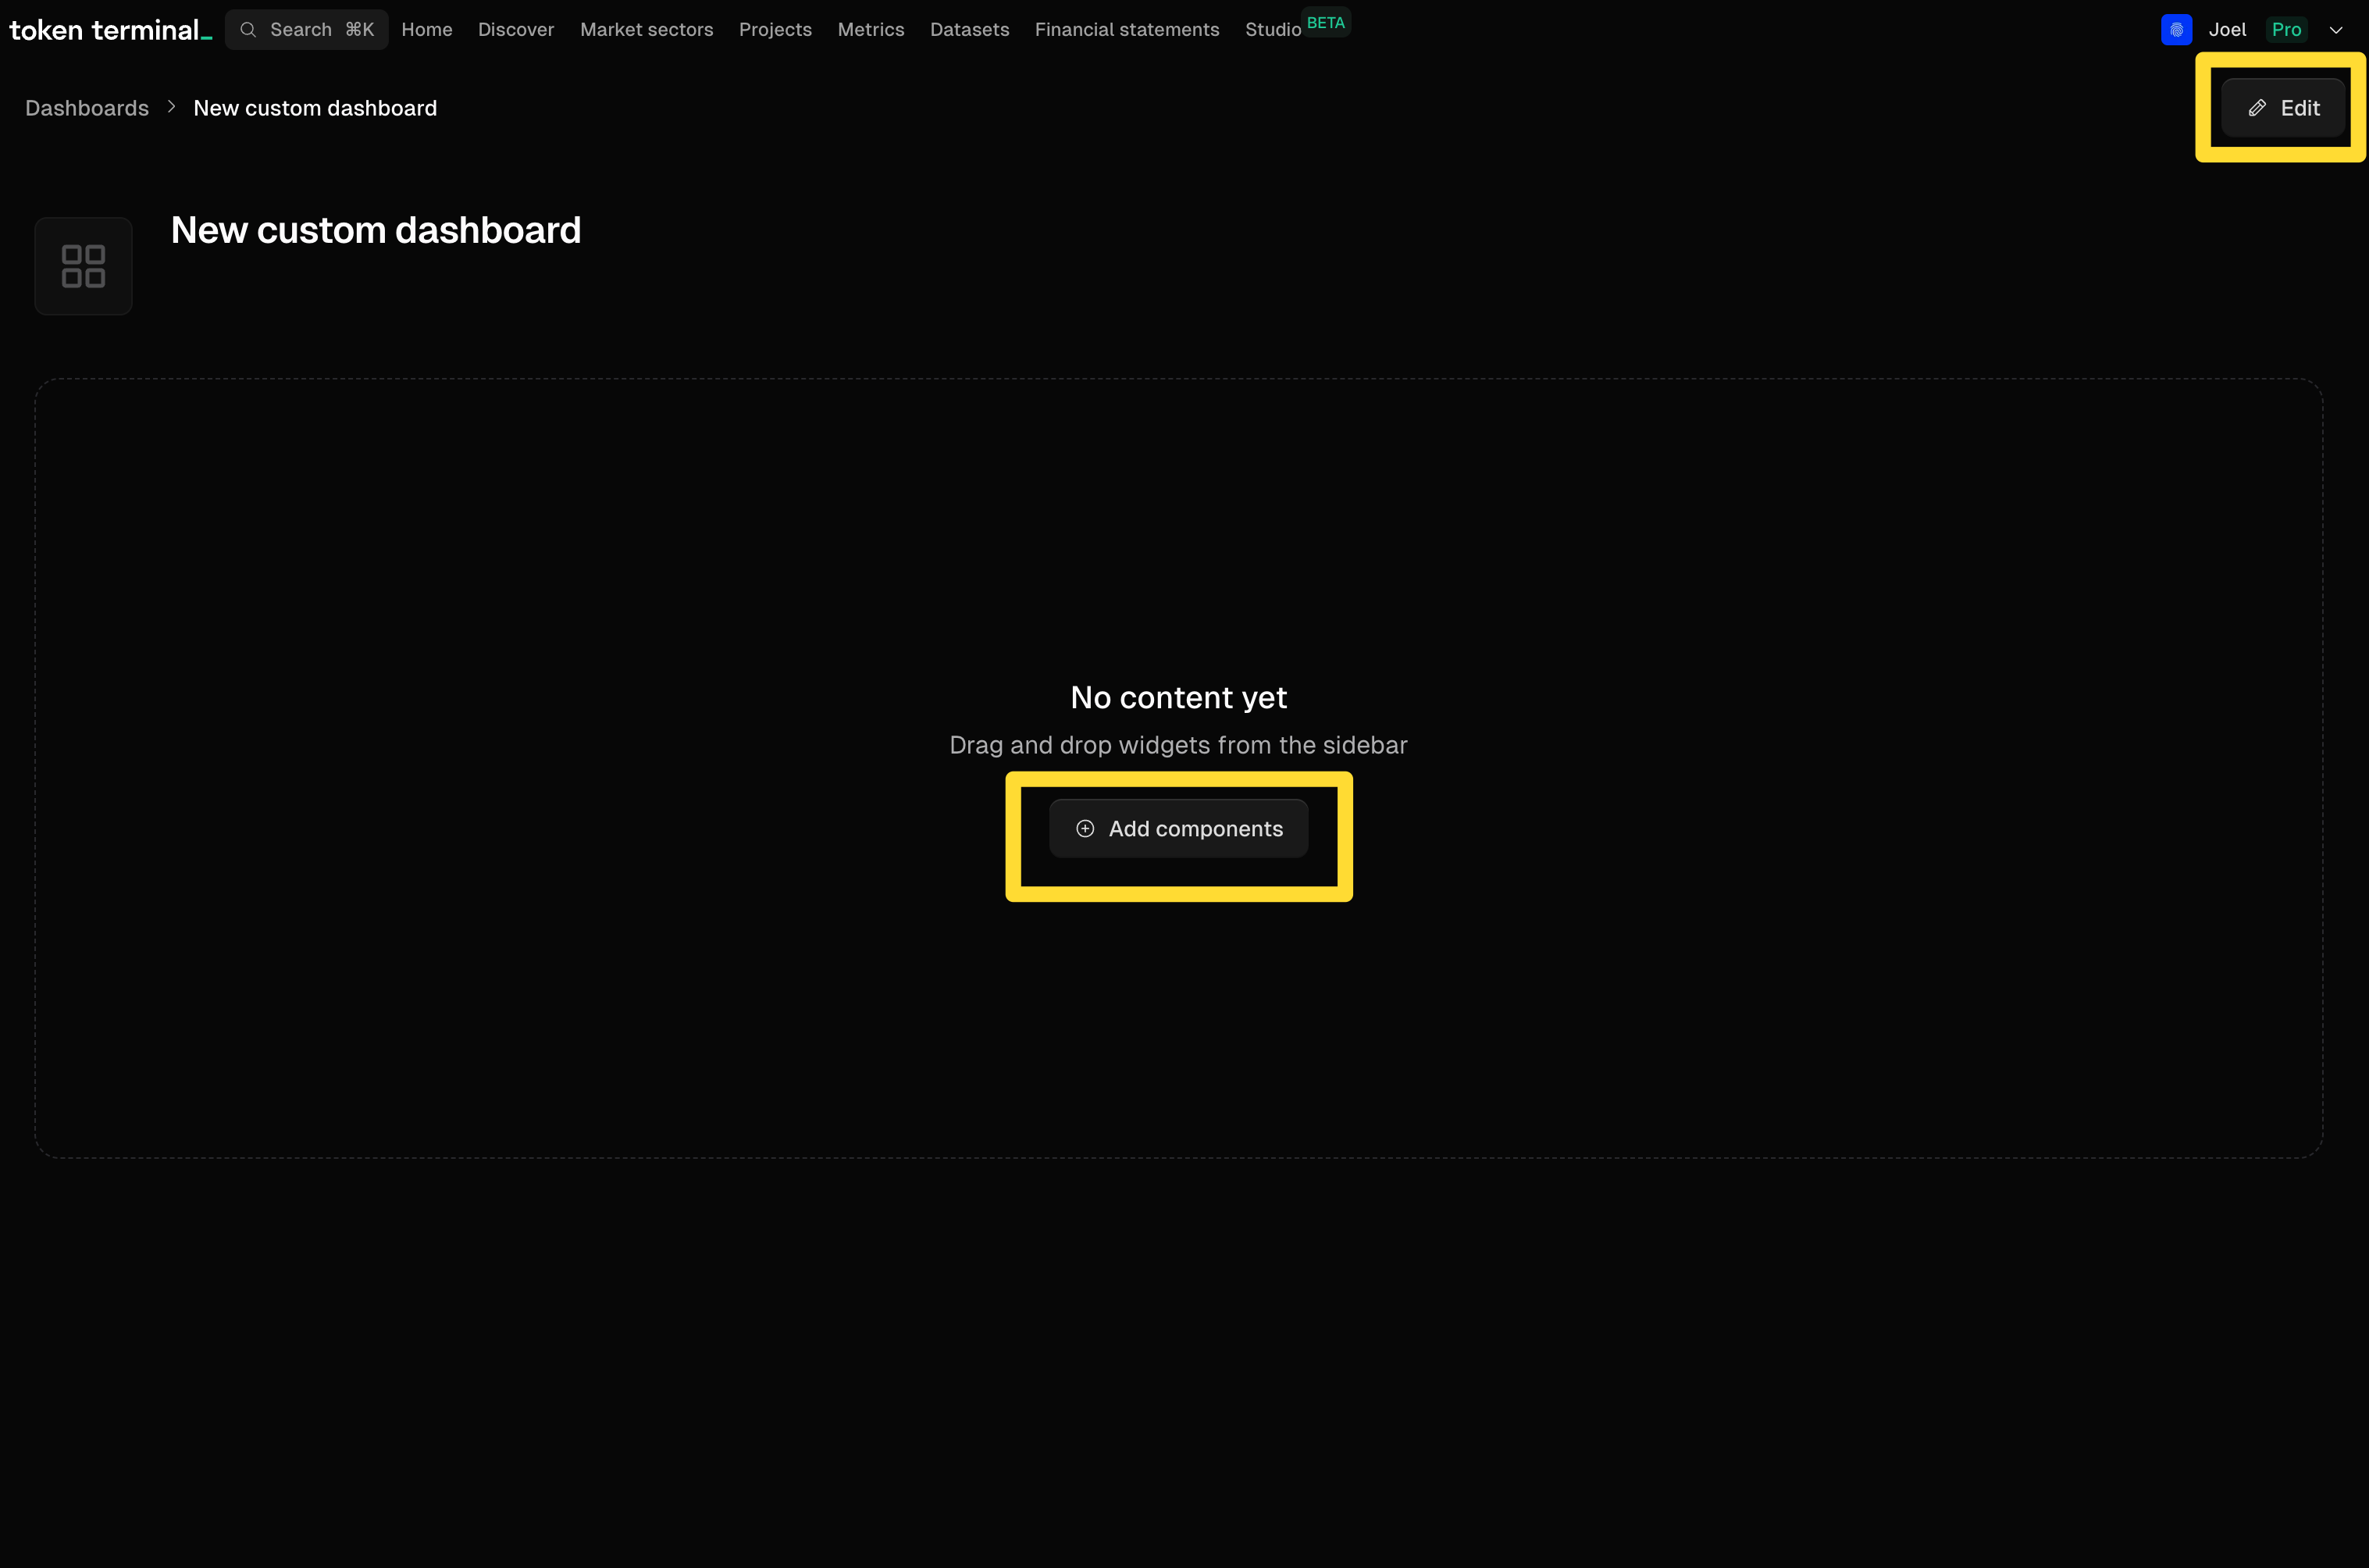
Next, you'll see a screen that prompts to "Edit" or "Add Components" to your dashboard, clicking either of these buttons will change you into "Edit Mode" for the dashboard and will allow you to add charts, datasets, and text.

When you're ready to preview your work, click the green "Save" button in the upper right hand corner.

Adding Charts
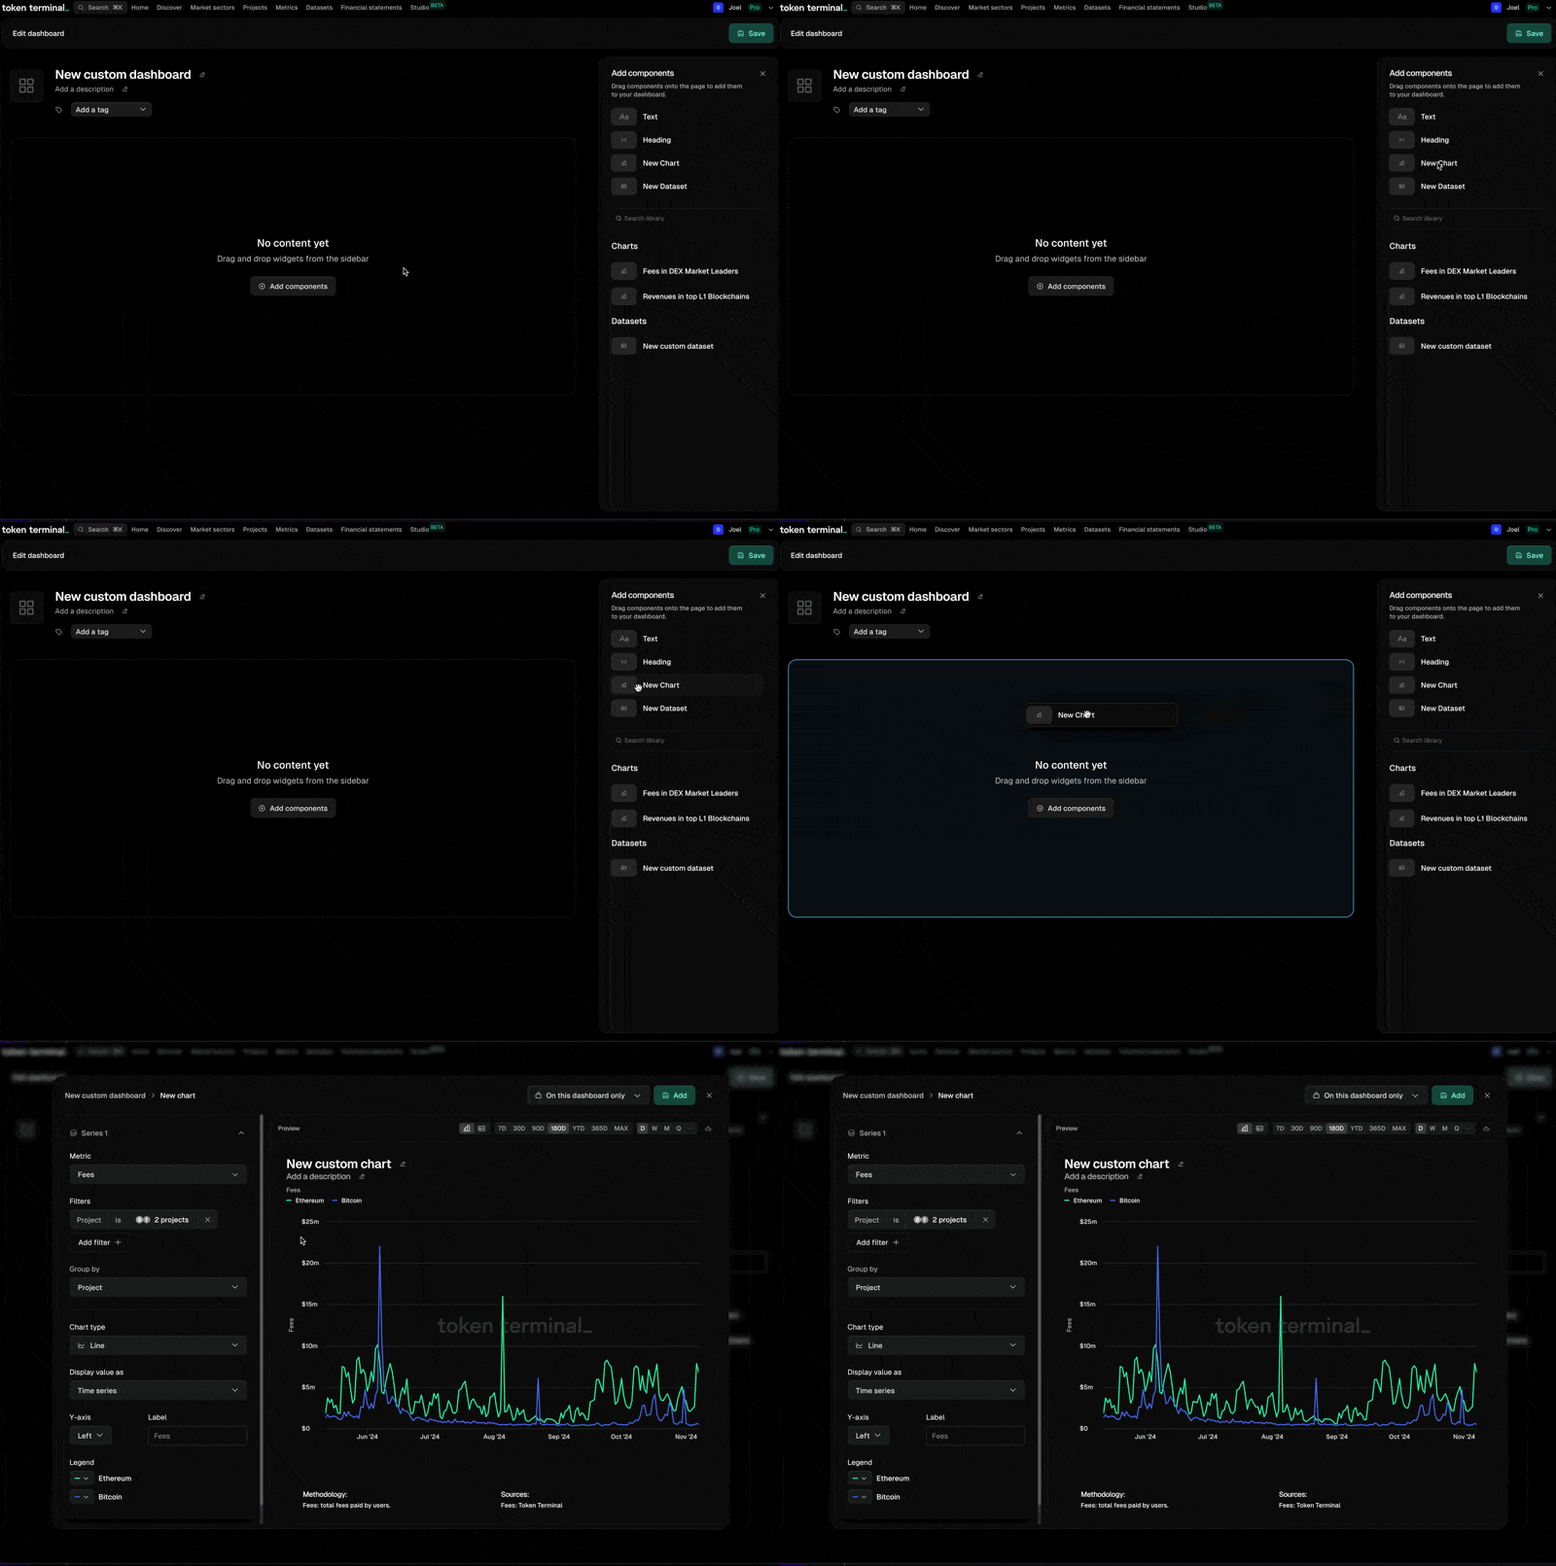
To add a new chart, click and drag the "New Chart" option in the Add Components sidebar. Drag the new chart into the dashboard where you'd like it to be located, and the new chart editor will appear. Read more editing charts on the Charts page.

To add a chart from your chart library, scroll or search the charts in the right hand sidebar and drag the chart out that you'd like to include in your dashboard, dropping it in the row where you'd like it to be displayed.
Adding Datasets
To add a new dataset, click and drag the "New Dataset" option in the Add Components sidebar. Drag the new dataset into the dashboard where you'd like it to be located, and the new dataset editor will appear. Read more editing charts on the Datasets page.
To add a dataset from your dataset library, scroll or search the dataset in the right hand sidebar and drag the dataset out that you'd like to include in your dashboard, dropping it in the row where you'd like it to be displayed.
Adding Text and Images
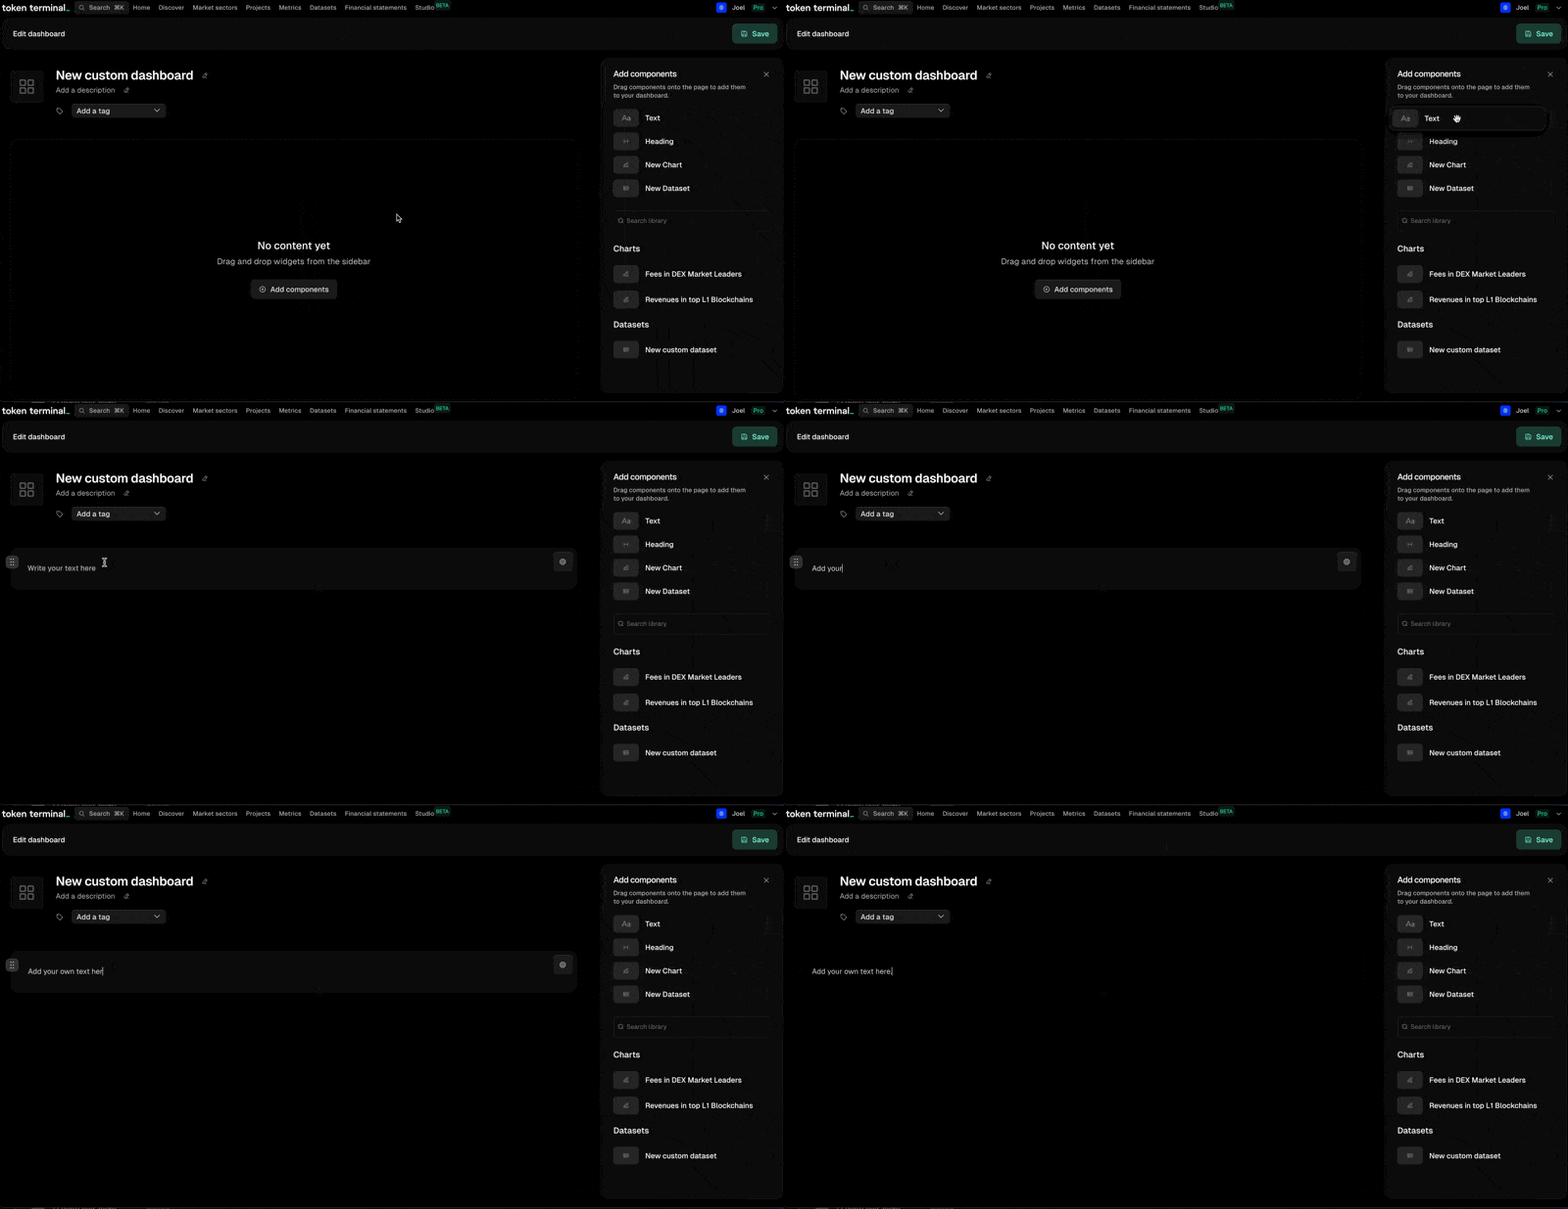
To add a text area to your dashboard, click and drag the "Text" option in the Add Components sidebar. Drag the text area into the dashboard where you'd like it to be located, and text editor will appear. Click into the text editor to start editing.

To style your text, you have a few options. You can begin typing and highlight the text in order to trigger the floating style bar where you can update the text type, including Heading 1, Heading 2, Body, Unordered list, or Ordered list as well as typical styles like Bold and Italic. Additionally, the tool bar allows you to add links and images to your text area.
You can use MarkDown to quickly create different types and styles of text. Read more about the markdown style we use here: https://www.markdownguide.org/basic-syntax/
Lastly, you can also use slash commands to easily add different types of text styles as well as links and images. Just type "/" to see the available options.
Adding Headings
You can add headings to your dashboard to create clear separations of content in your dashboard. Headings have unique spacing to make it easier for your user to distinguish between the sections in your dashboard.
To add a heading, click and drag the "Heading" option in the Add Components sidebar. Drag the heading into the dashboard where you'd like it to be located, and a text editor will appear. Click into the text editor to start editing.
Working with Layout in Dashboards
Laying out a dashboard in Studio is all based on rows. Content like charts, datasets and text can be combined together into full-width rows that make it easy to create complete looking dashboards.
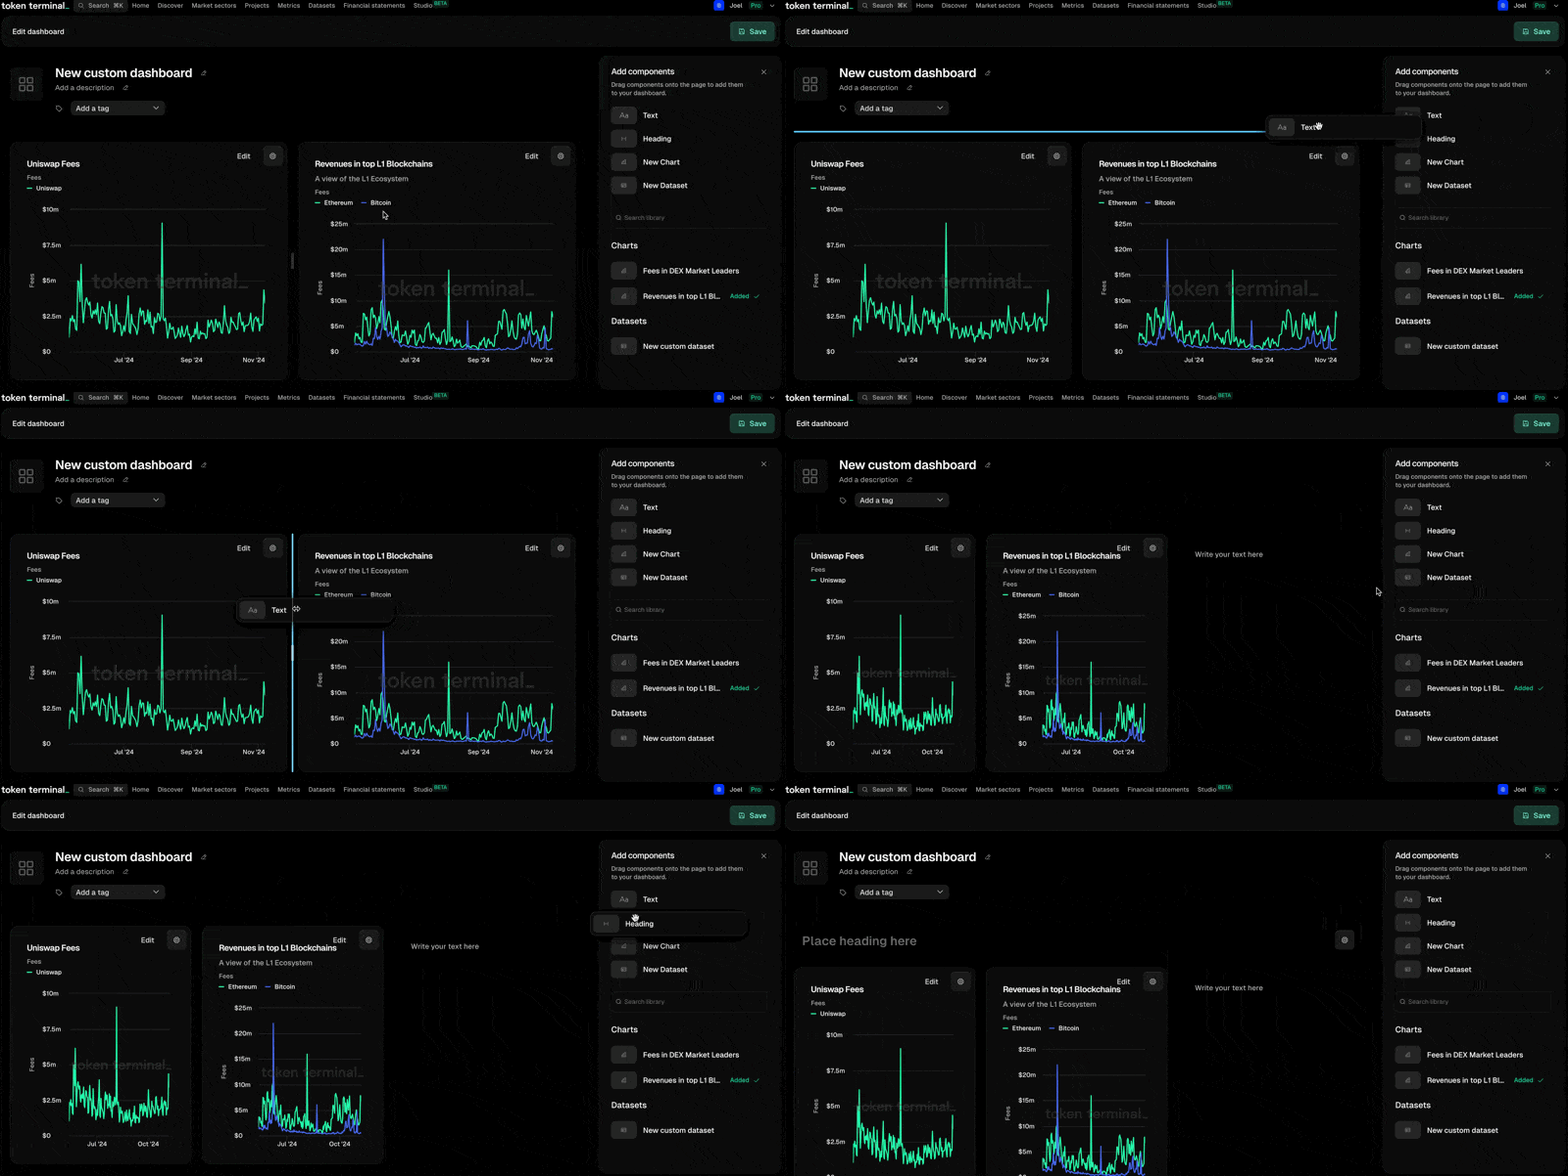
To add content to a row, drag an item from the sidebar or from anywhere in the dashboard and drag it beside any other item on the dashboard. A blue line should appear to indicate the dropzones for your piece of content.
To add content as a new separate row, drag the item two the space below or above any existing row and a full width blue line should appear to indicate a dropzone for your content.

Sharing Dashboards
You can share your dashboard with anyone who can access the internet by clicking the "Share" button in the top row of your dashboard. This will copy a publicly accessible version of your dashboard that you can share around with your team or public audiences.
Cloning Dashboards
Any dashboard that you have created can easily be cloned while viewing the dashboard or viewing your list of dashboards in Studio. When you clone your own dashboard, you will create a copy of your dashboard with any charts or datatsets saved in your library re-used and still connected as the same library item. Any additional charts will be copied as new charts and edits there won't affect your original charts.
When cloning a dashboard from outside your team on Token Terminal, all charts and datasets will be copied as dashboard-only charts.
Updated 4 months ago