
GMV data
Data relating to the usage of the protocol
Total value locked (TVL)
What is this metric: User deposits to the protocol's smart contracts (these assets are not owned by the protocol).
How it is calculated: Value of funds held across a protocol's smart contracts.
Why do we show it: Shows how much value users are willing to deposit to a protocol's contracts, i.e. if there is trust in the protocol's contracts (security-wise).
Example:
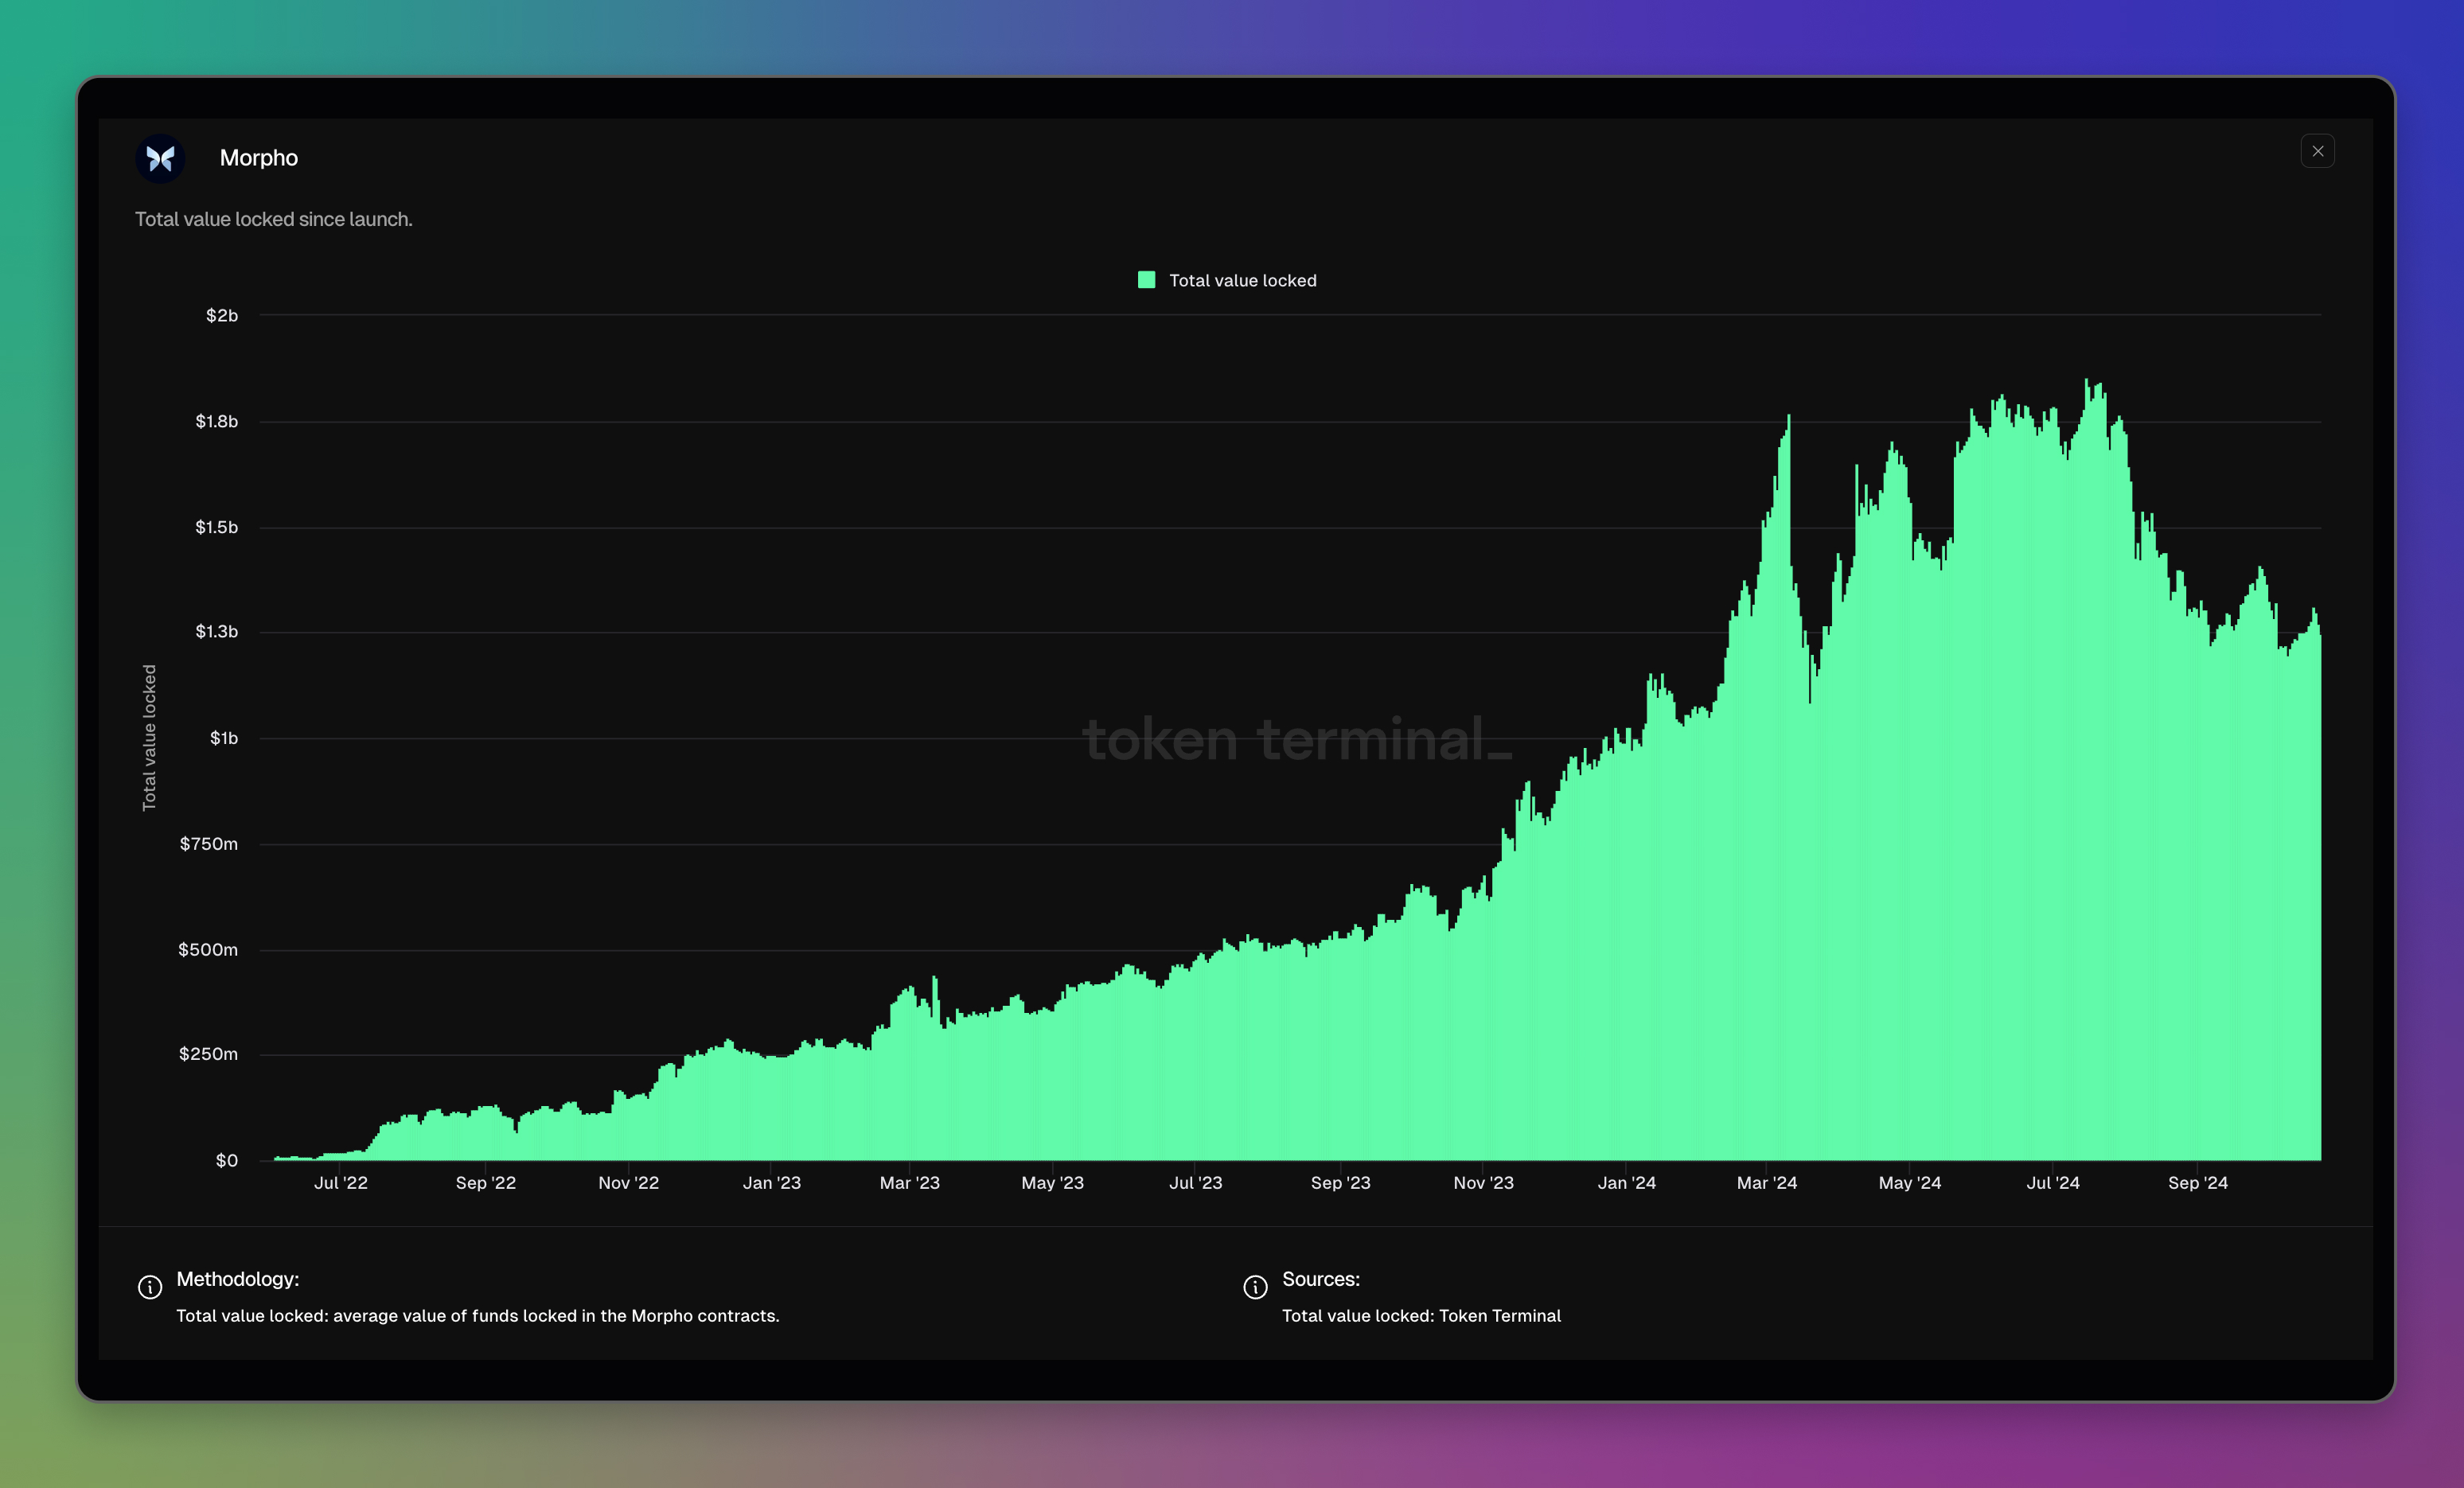
Moprho dashboard: <https://tokenterminal.com/terminal/projects/morpho>
Trading volume (DEX / NFT marketplace)
What is this metric: Trading volume on a DEX / NFT marketplace.
How it is calculated: Value of tokens being exchanged at a DEX / NFT marketplace.
Why do we show it: Shows how much value traders are willing to trade on a DEX / NFT marketplace, i.e. if there is trust in the DEX / NFT marketplace to trade at scale.
Example:
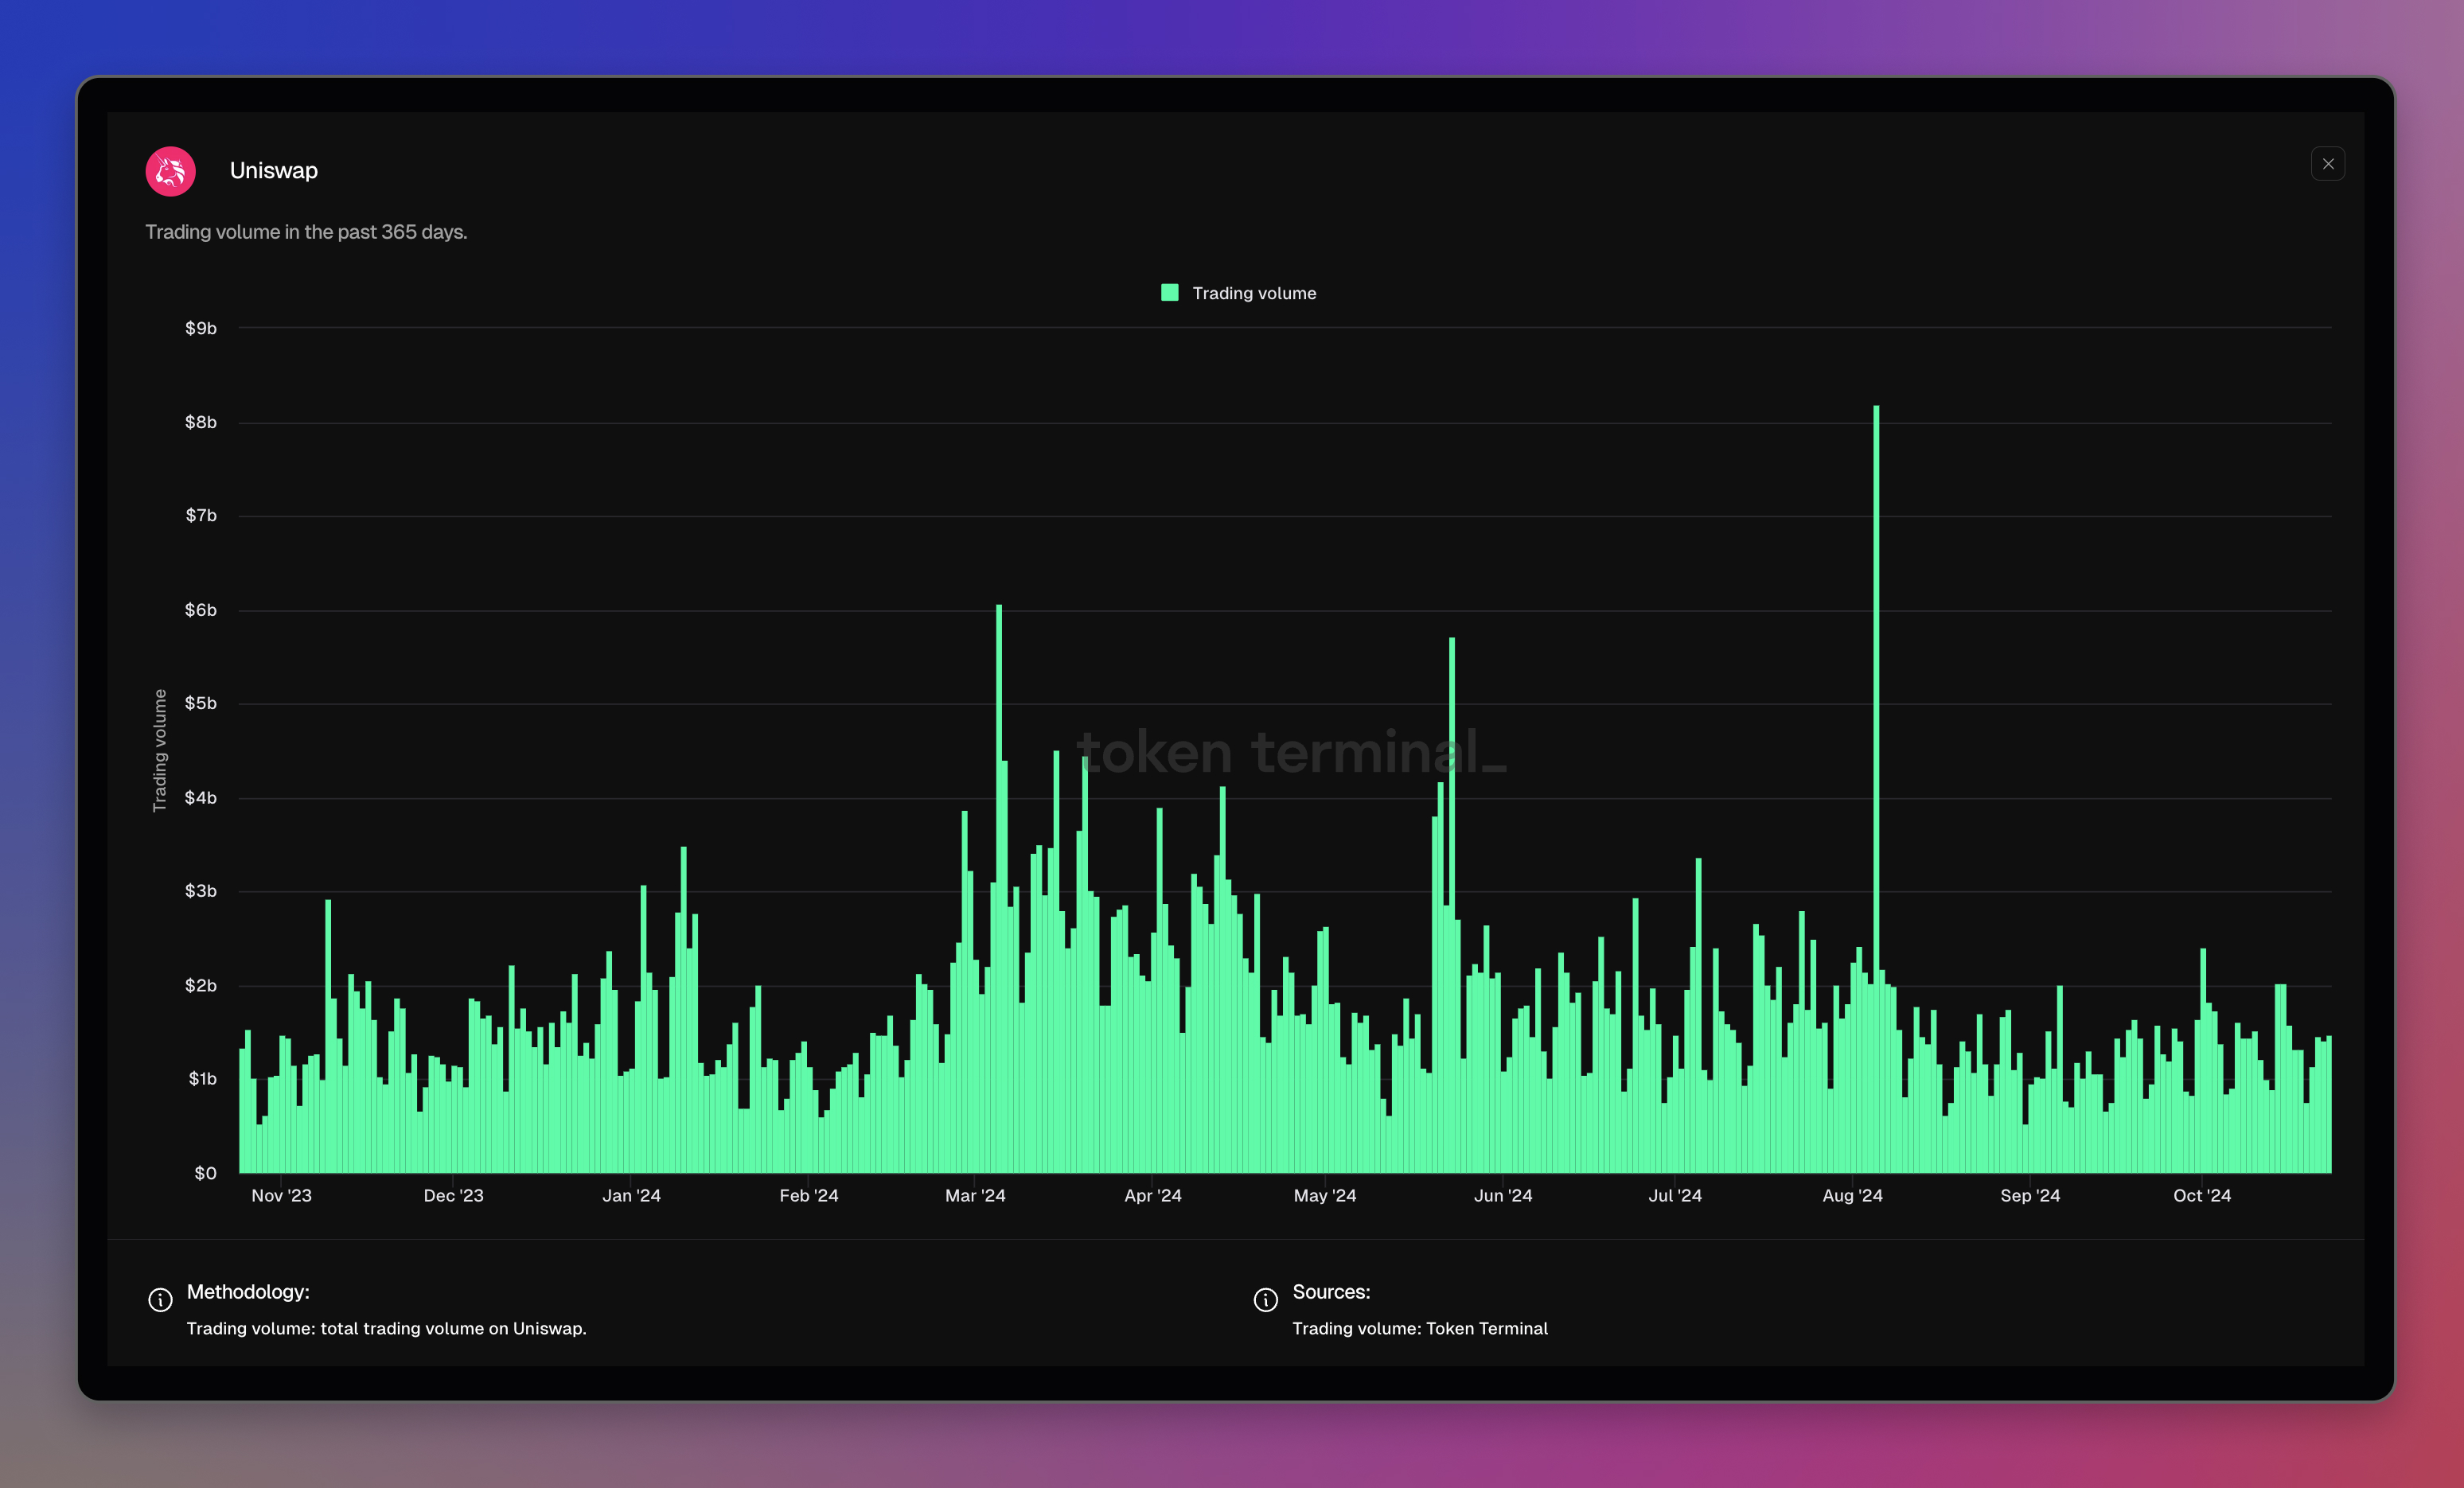
Uniswap dashboard: https://tokenterminal.com/terminal/projects/uniswap
Active loans (lending)
What is this metric: Outstanding loans on a lending protocol.
How it is calculated: Value of funds owed by borrowers to lenders.
Why do we show it: Shows how much value borrowers are willing to borrow on a protocol, i.e. if there is trust in the lending protocol to lend & borrow at scale.
Example:
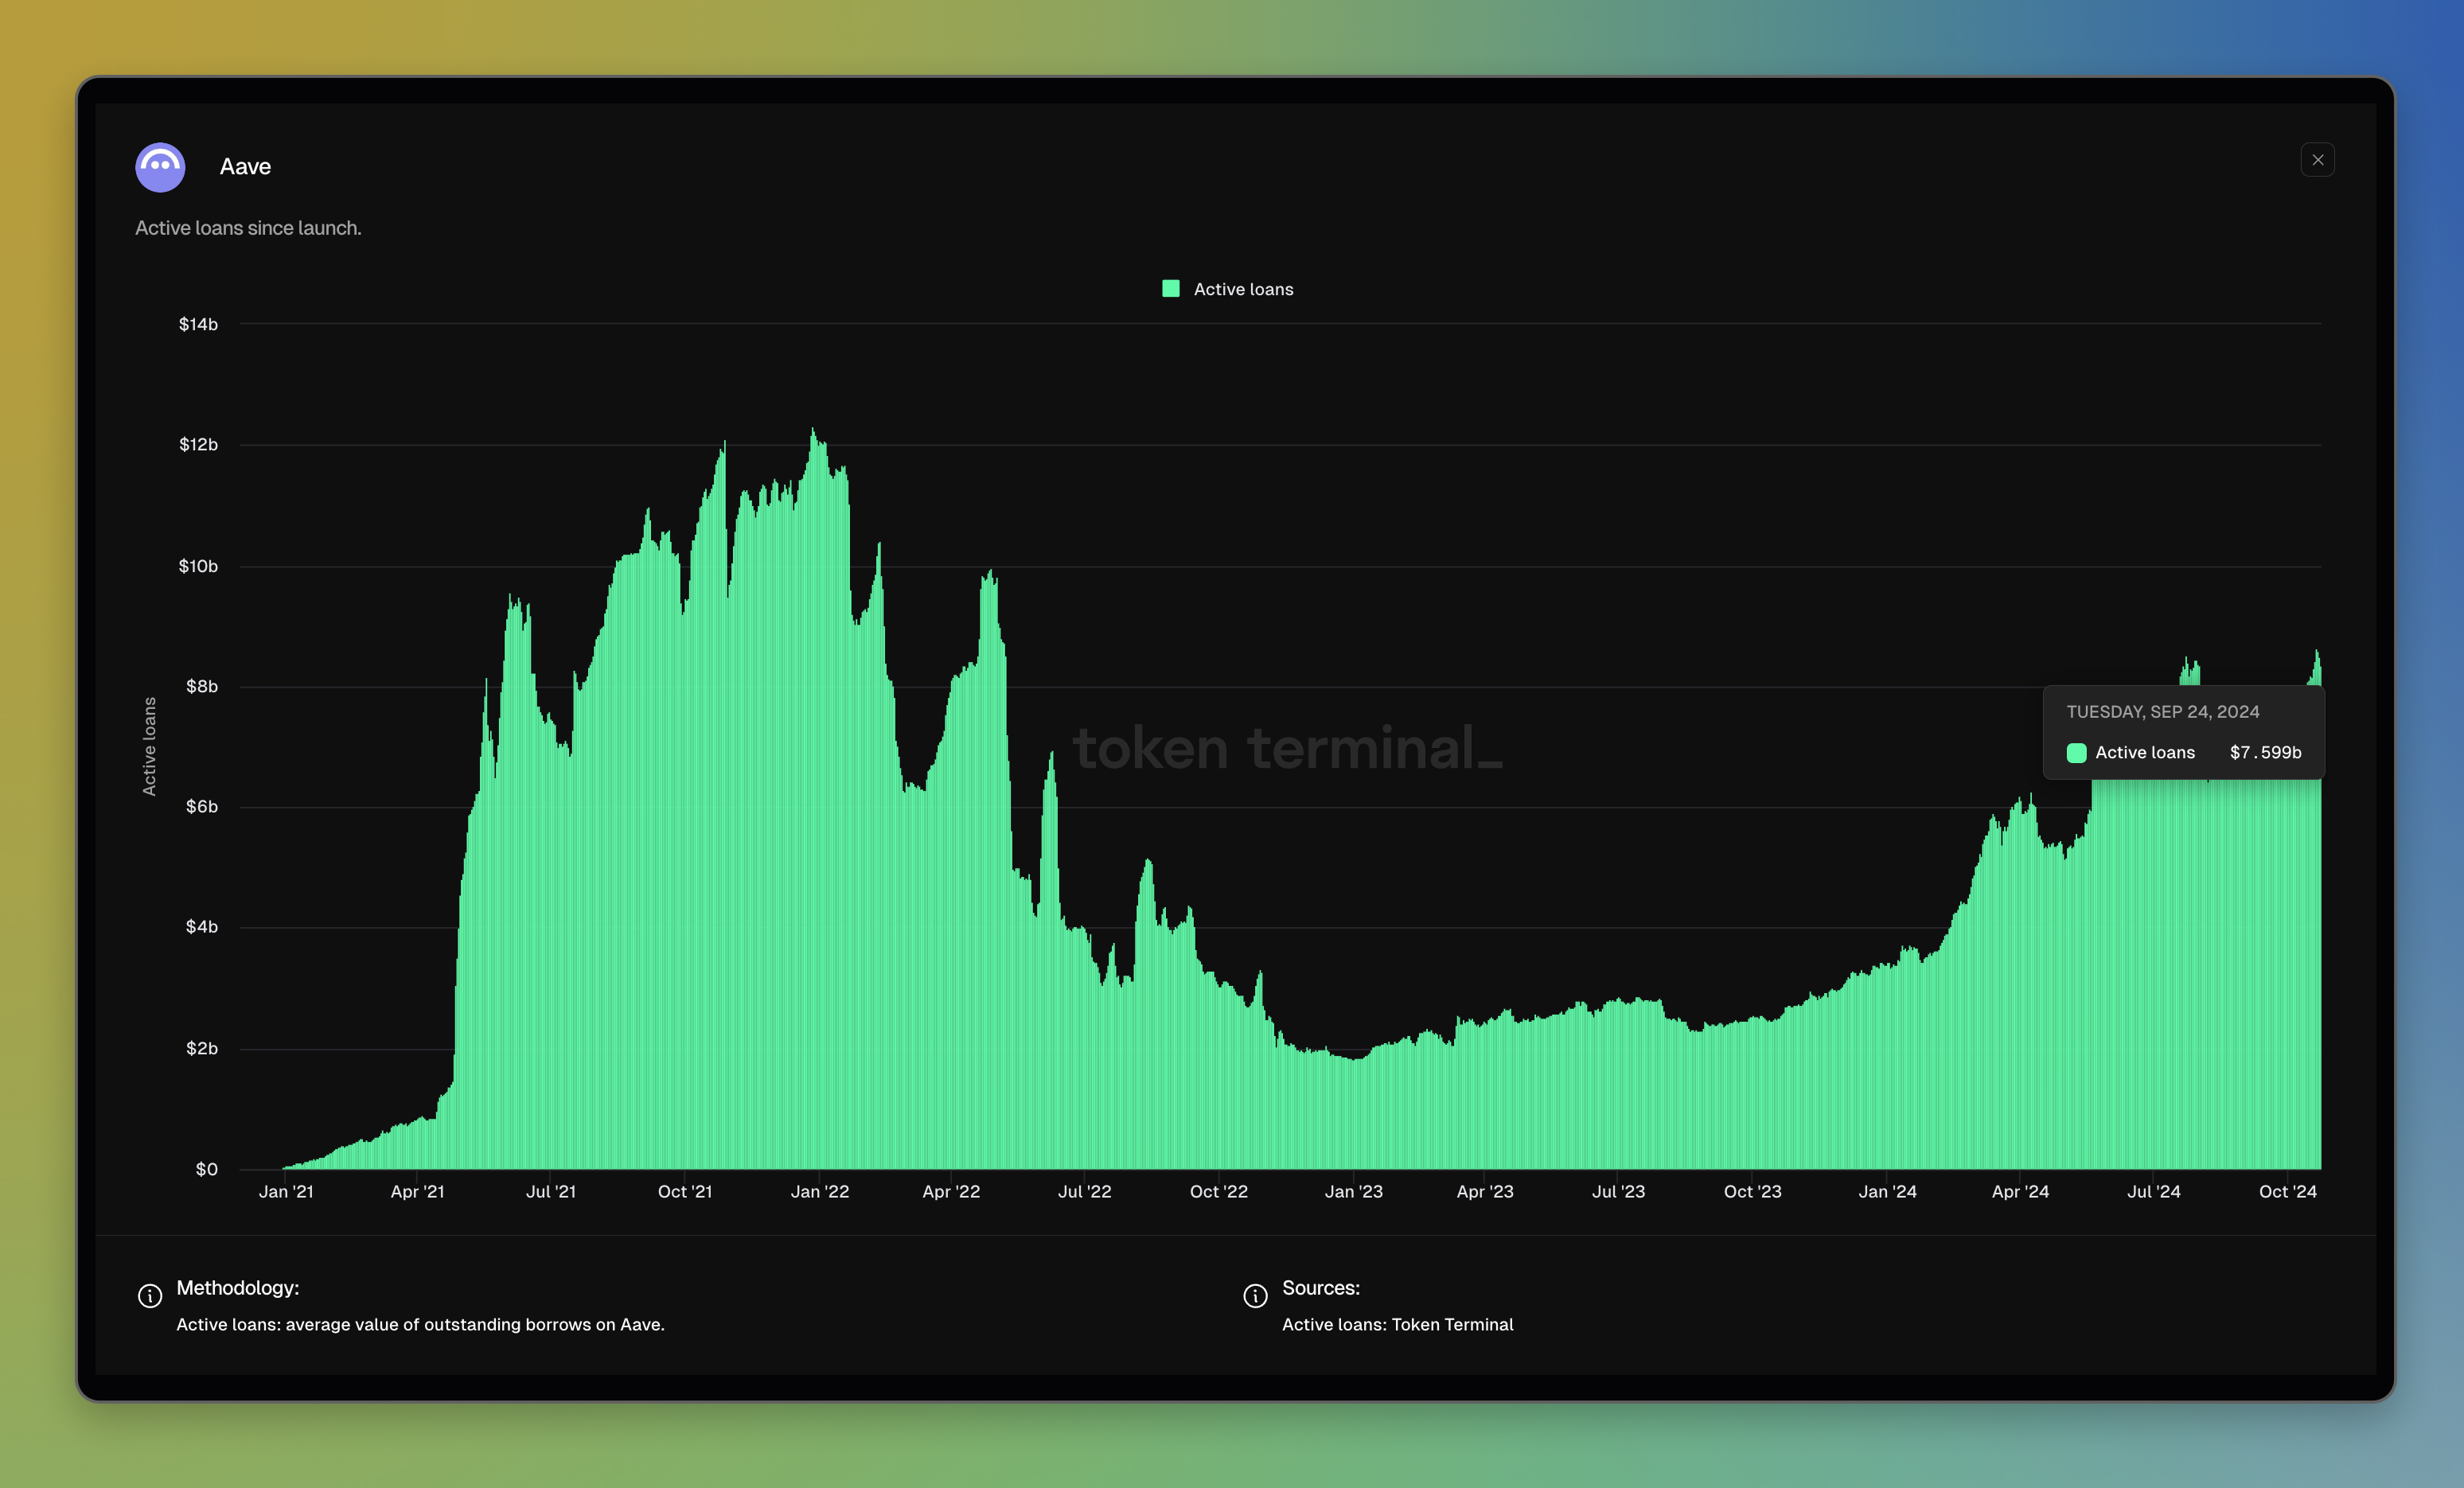
Aave dashboard: https://tokenterminal.com/terminal/projects/aave
Assets staked (liquid staking)
What is this metric: User deposits staked by a liquid staking protocol.
How it is calculated: Value of funds staked across the protocol's smart contracts.
Why do we show it: Shows how much value stakers are willing to stake through a protocol, i.e. if there is trust in the liquid staking protocol to stake at scale.
Example:
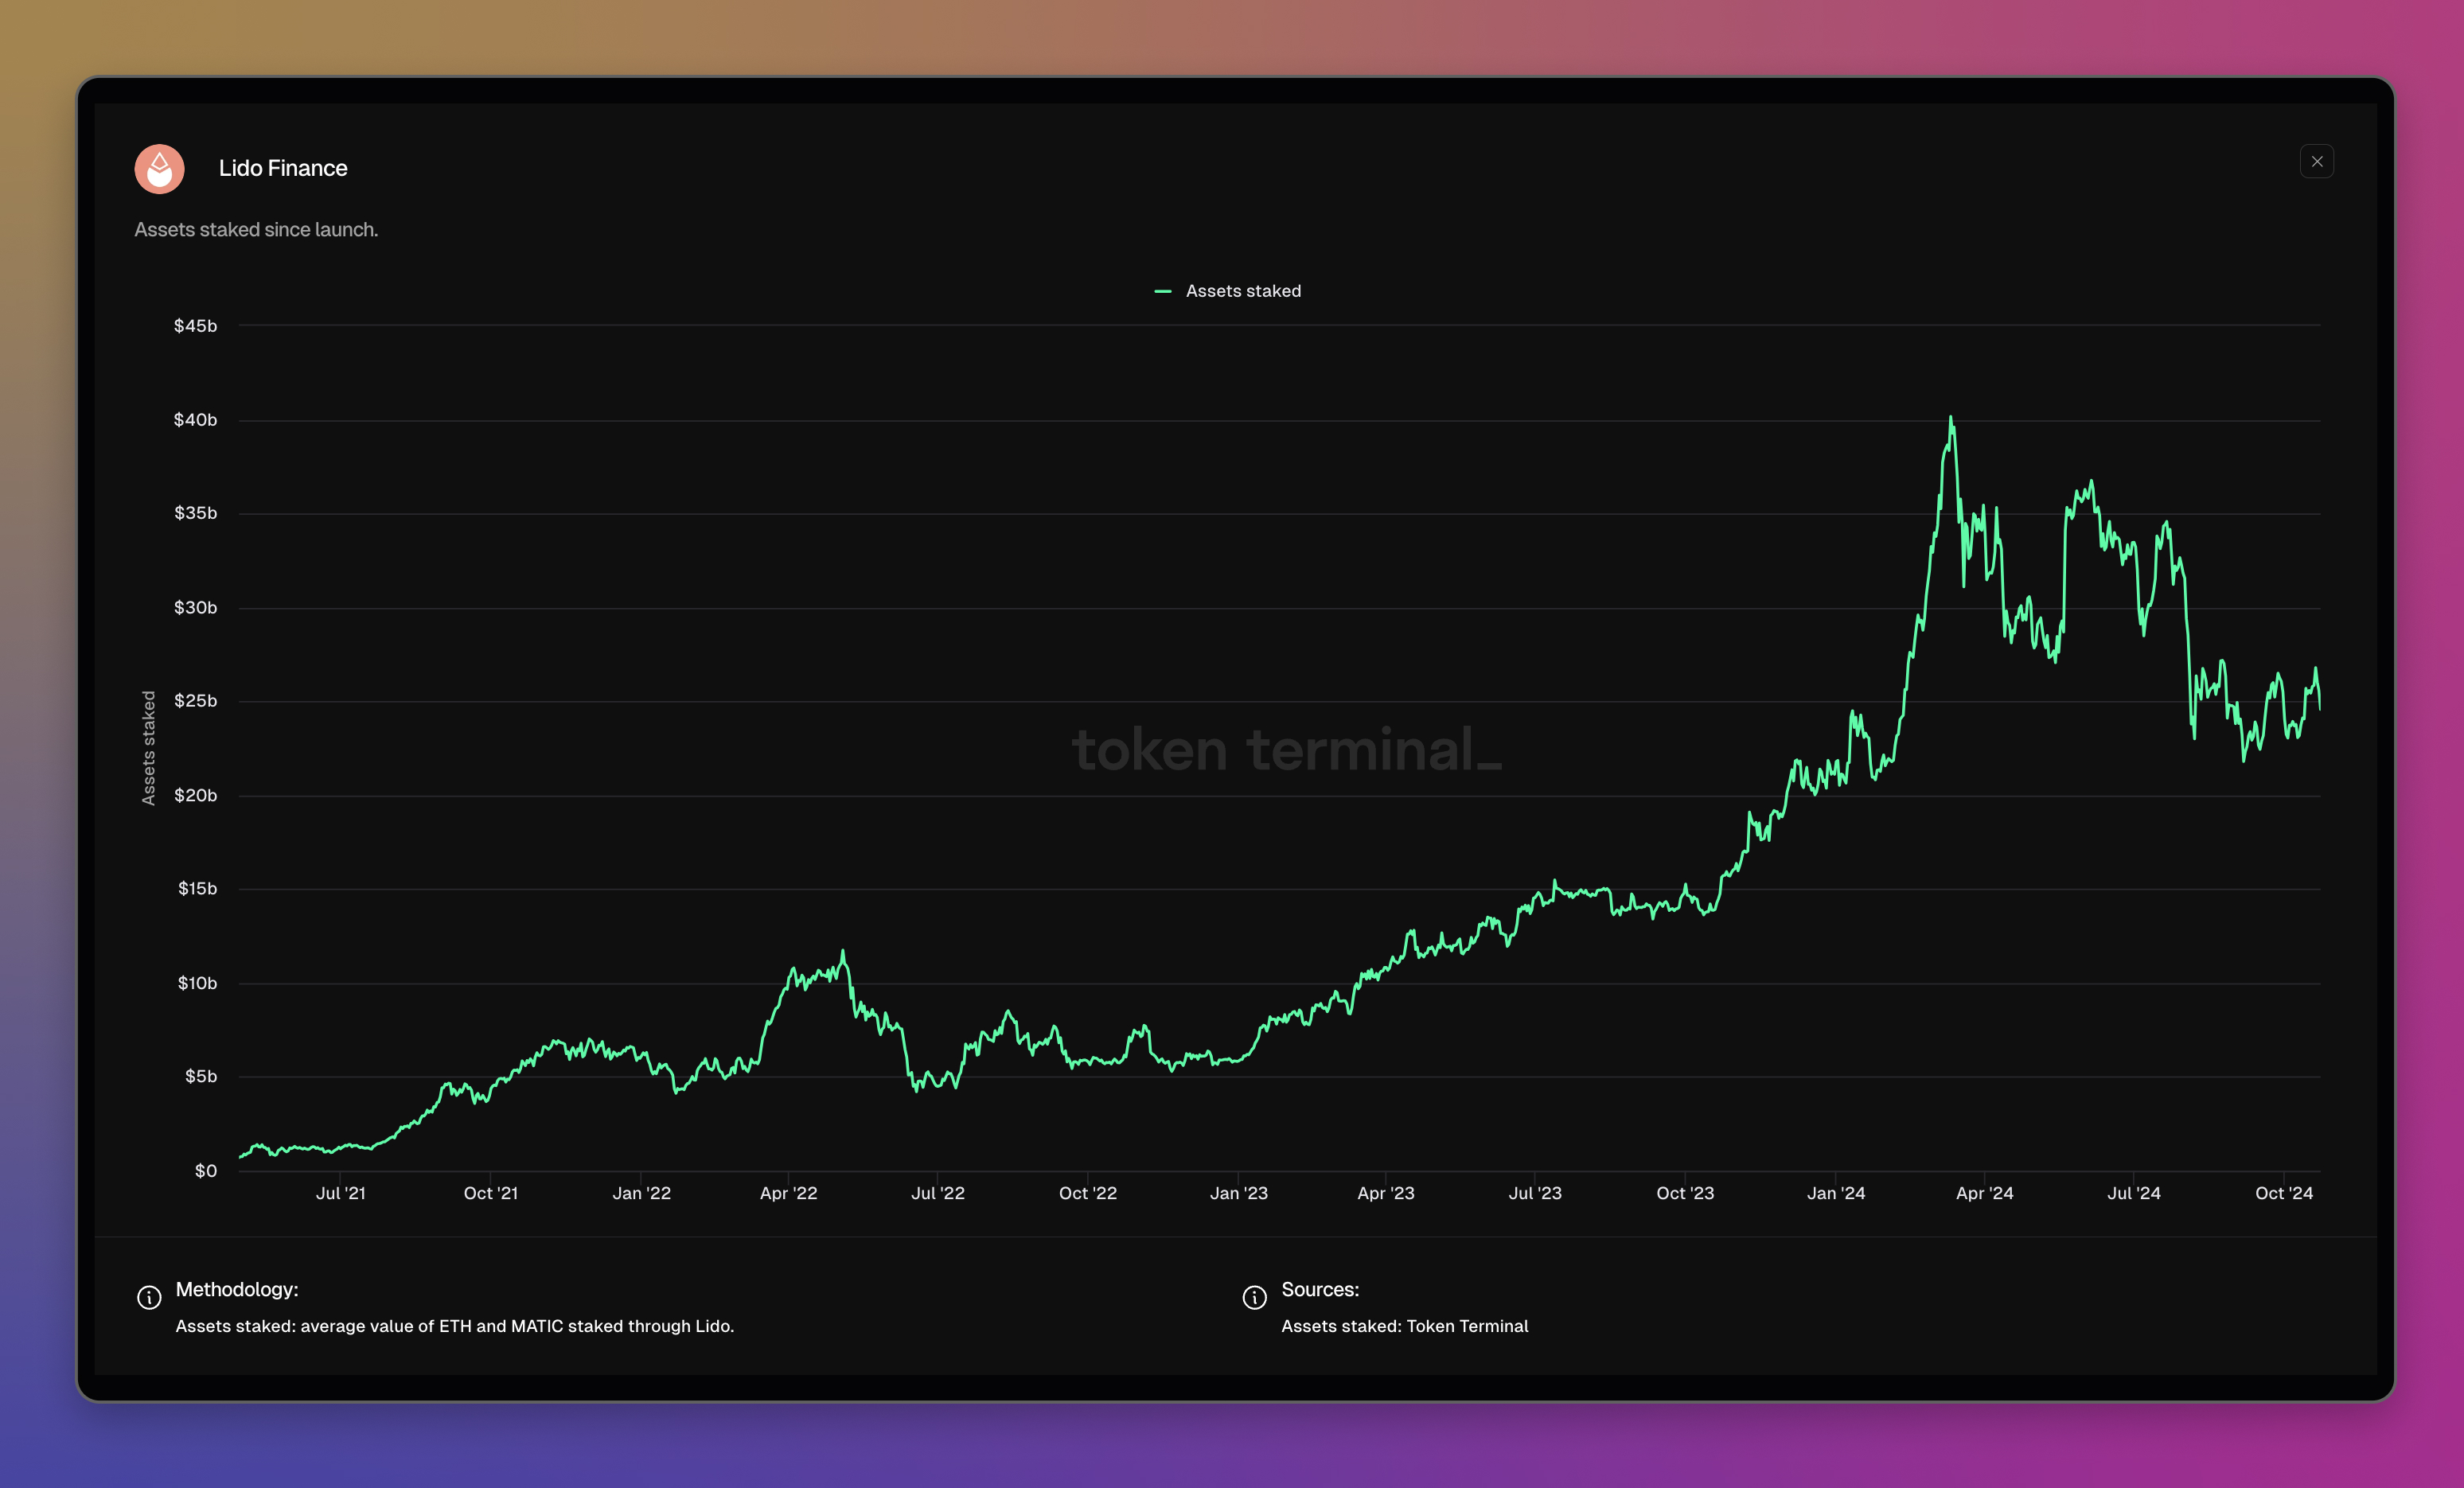
Lido dashboard: https://tokenterminal.com/terminal/projects/lido-finance
Transfer volume (cross-chain bridging)
What is this metric: Tokens transferred through a cross-chain bridging protocol.
How it is calculated: Value of tokens transferred through a cross-chain bridge.
Why do we show it: Shows how much bridge users are willing to transfer through a bridging protocol, i.e. if there is trust in the bridging protocol to transfer at scale.
Example:
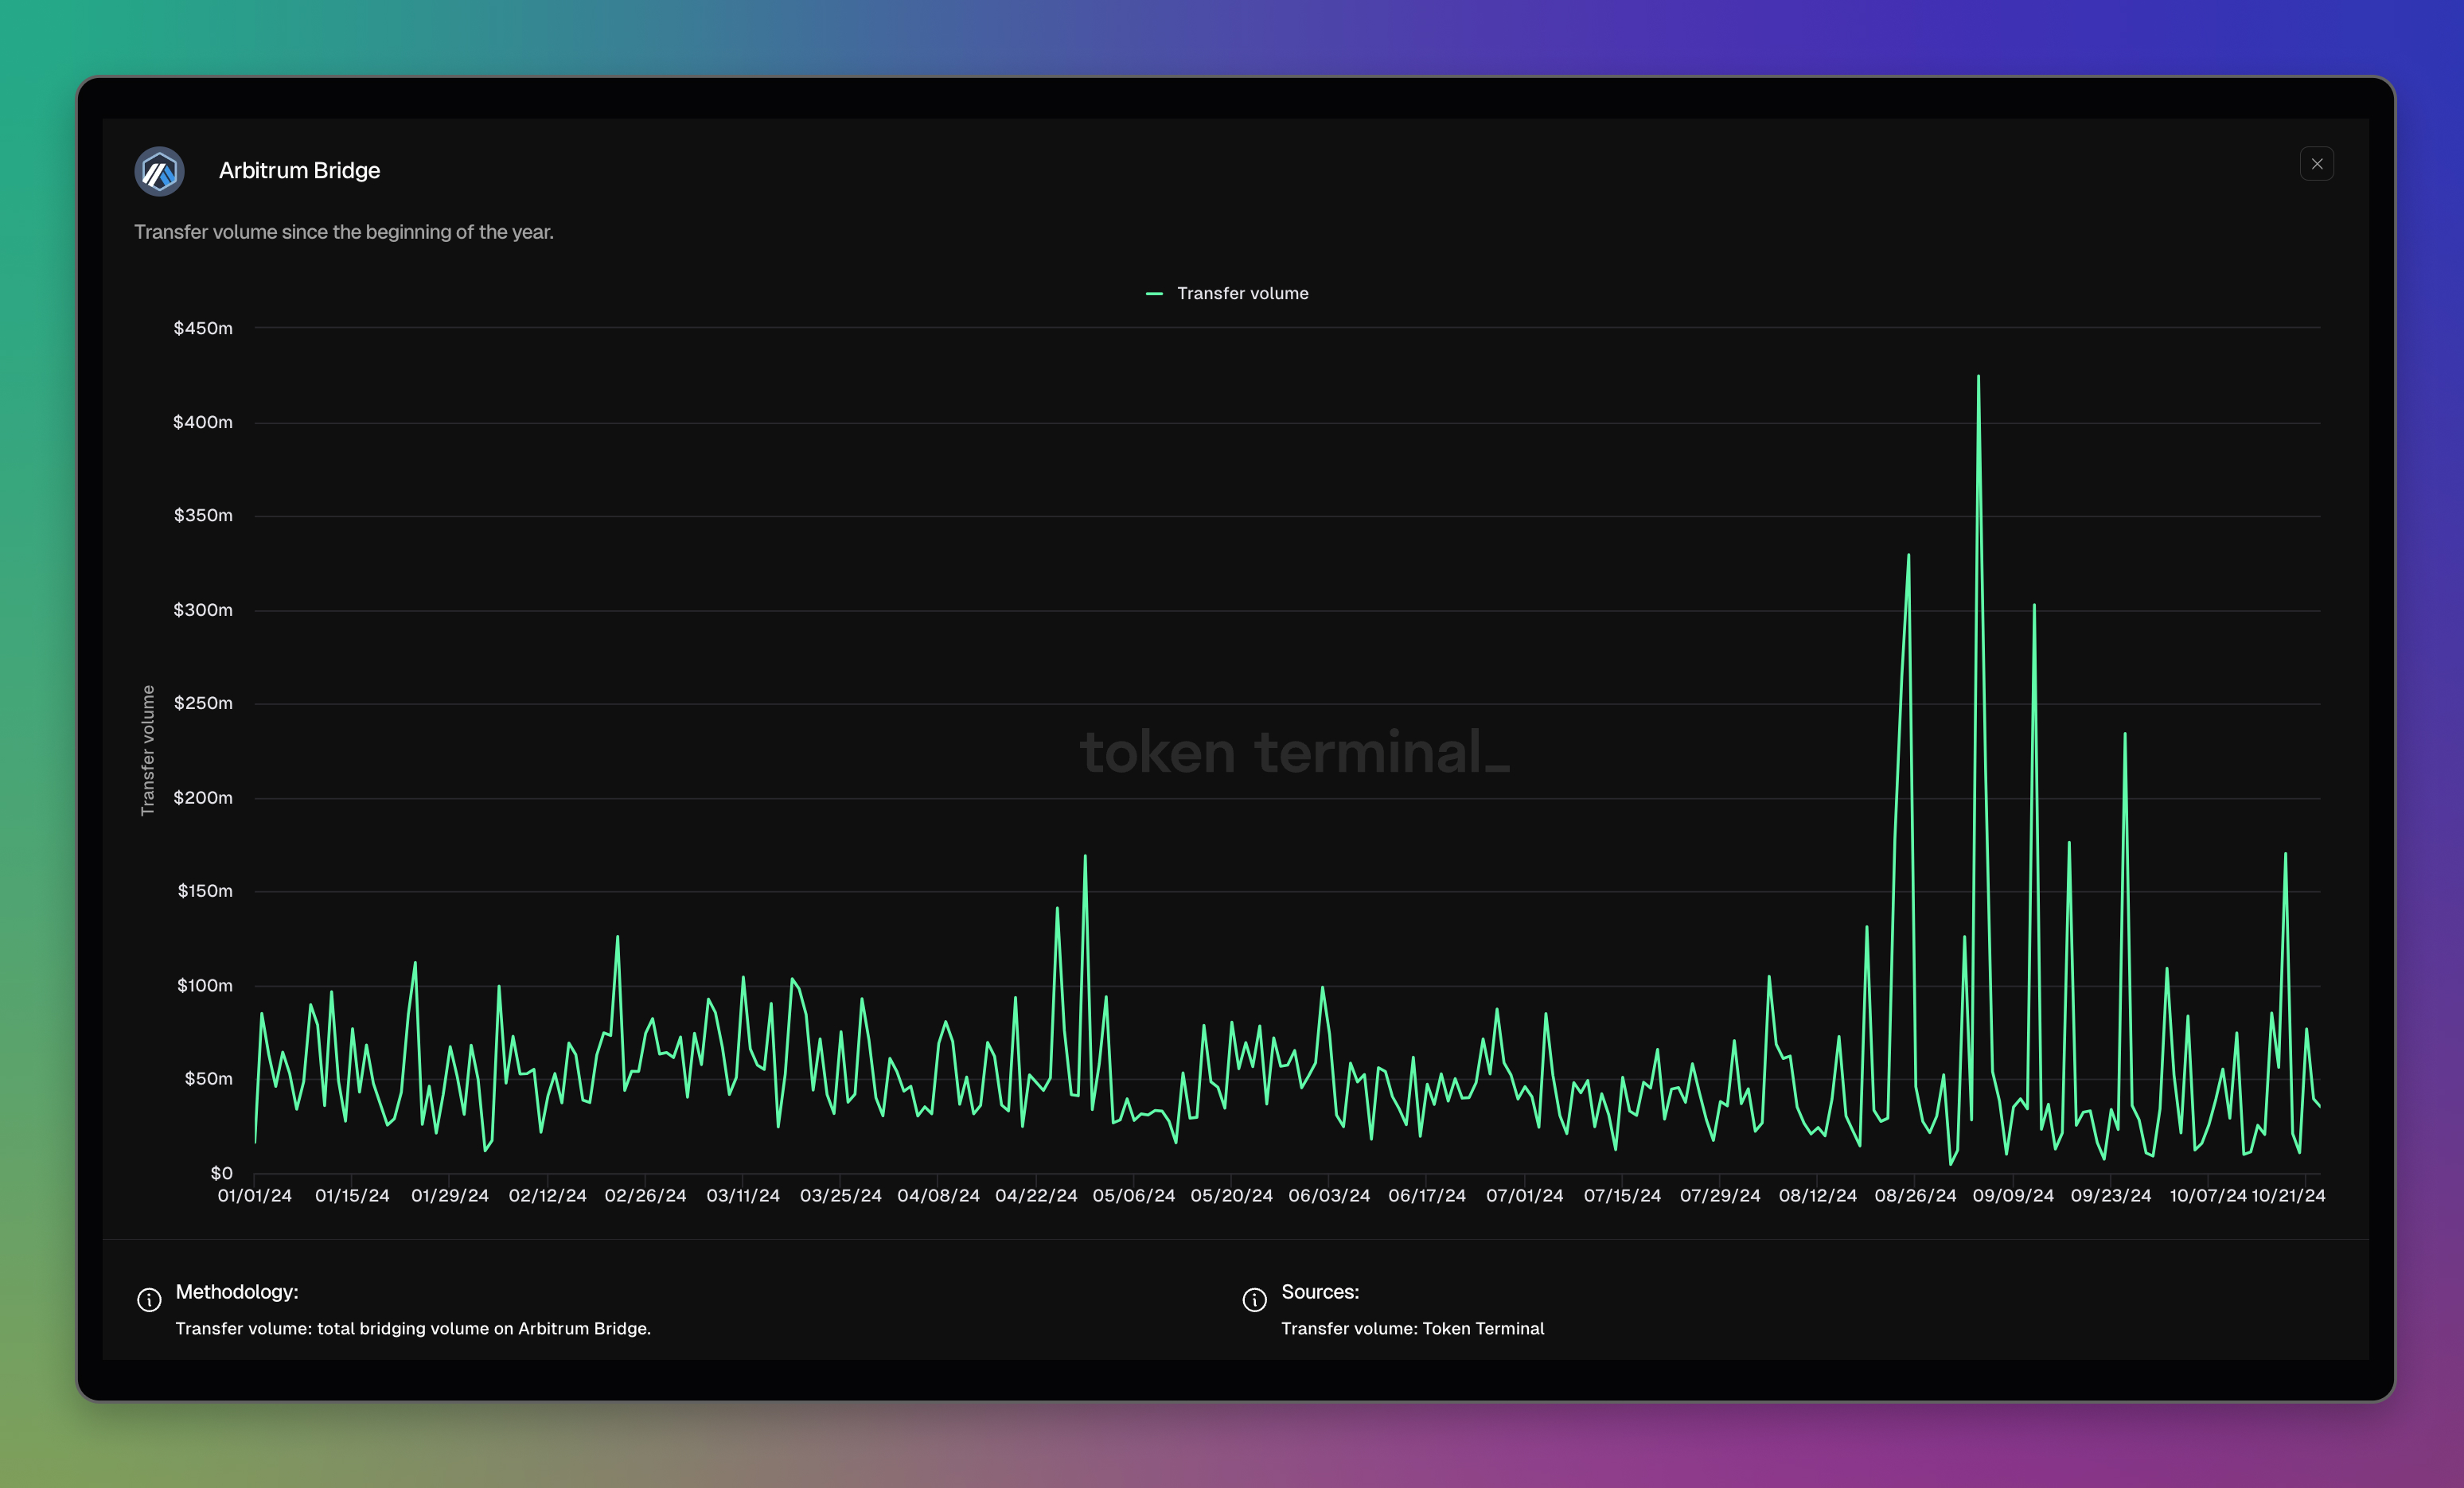
Arbitrum Bridge dashboard: <https://tokenterminal.com/terminal/projects/arbitrum-bridge>
Outstanding supply (stablecoin issuers)
What is this metric: The USD value of stablecoins outstanding.
How it is calculated: We track all stablecoin mints and burns.
Why do we show it: Shows the adoption of the stablecoin.
Example:
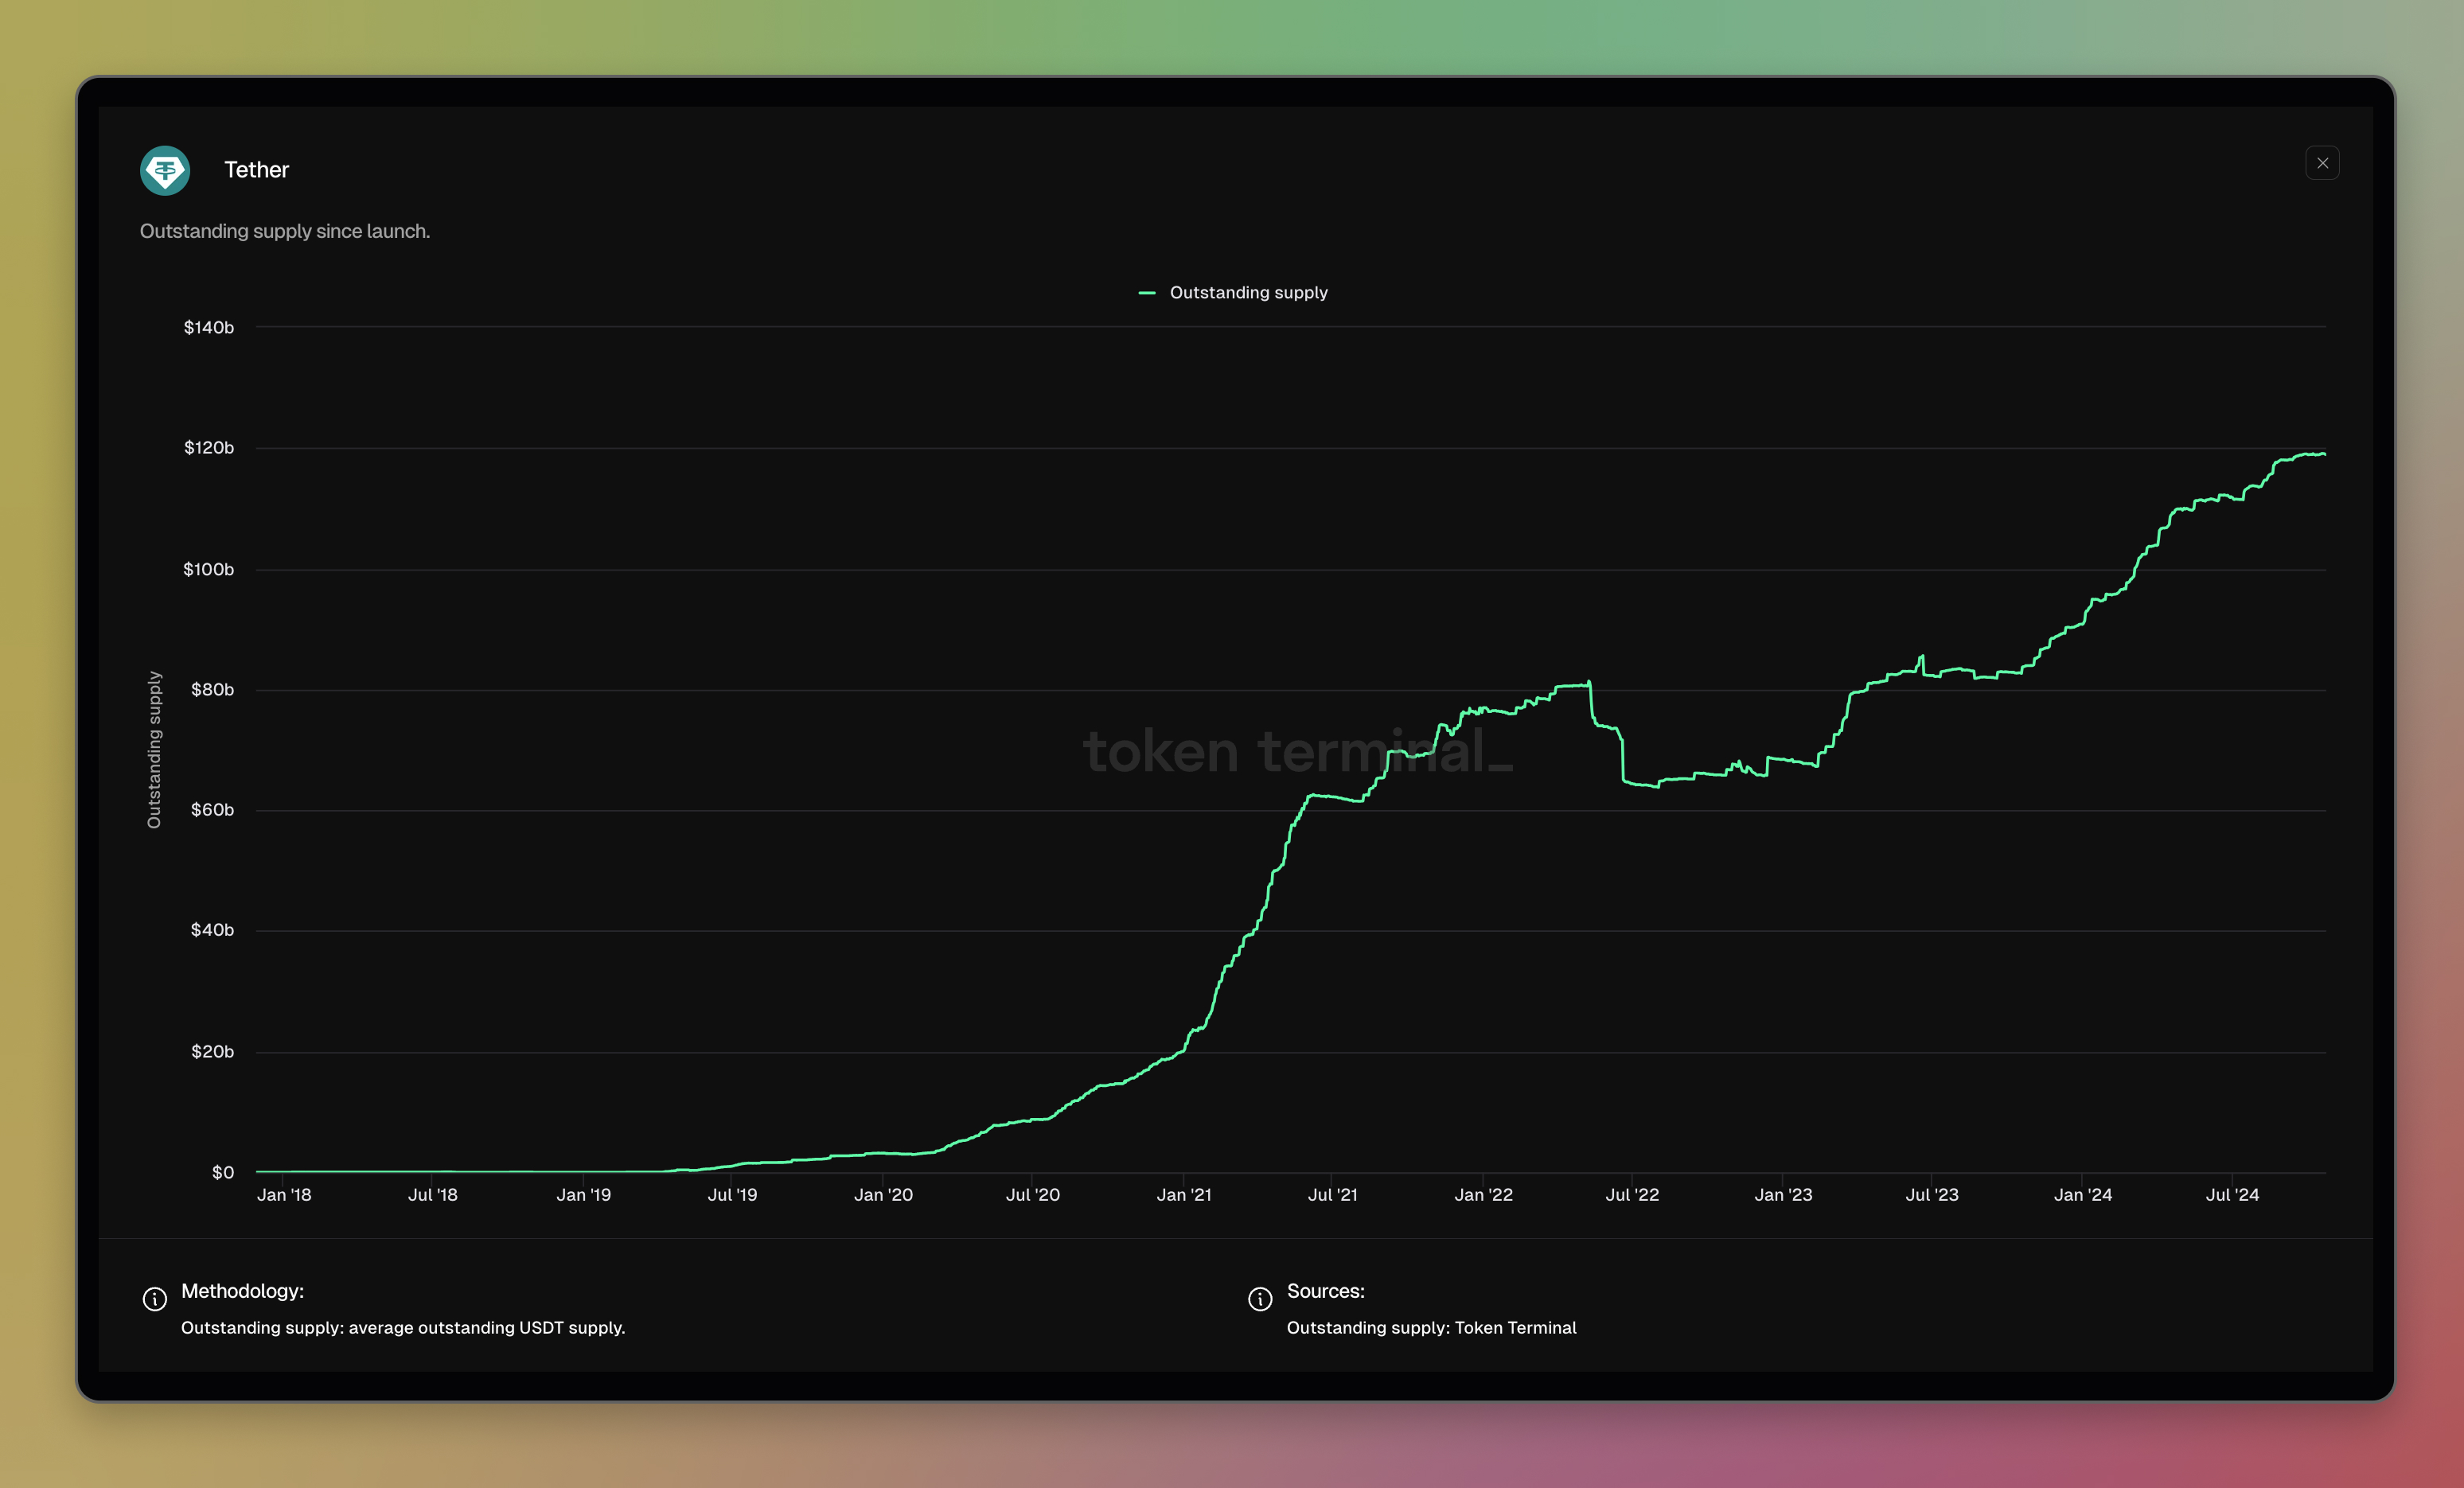
Tether dashboard: <https://tokenterminal.com/terminal/projects/tether>
Net deposits
What is this metric: Net deposits to a protocol.
How it is calculated: User deposits - user withdrawals.
Why do we show it: Shows the value of assets that users have deposited to a protocol. This is the amount that users potentially could withdraw from the protocol. A higher value potentially signals greater product market fit and user traction.
Example:
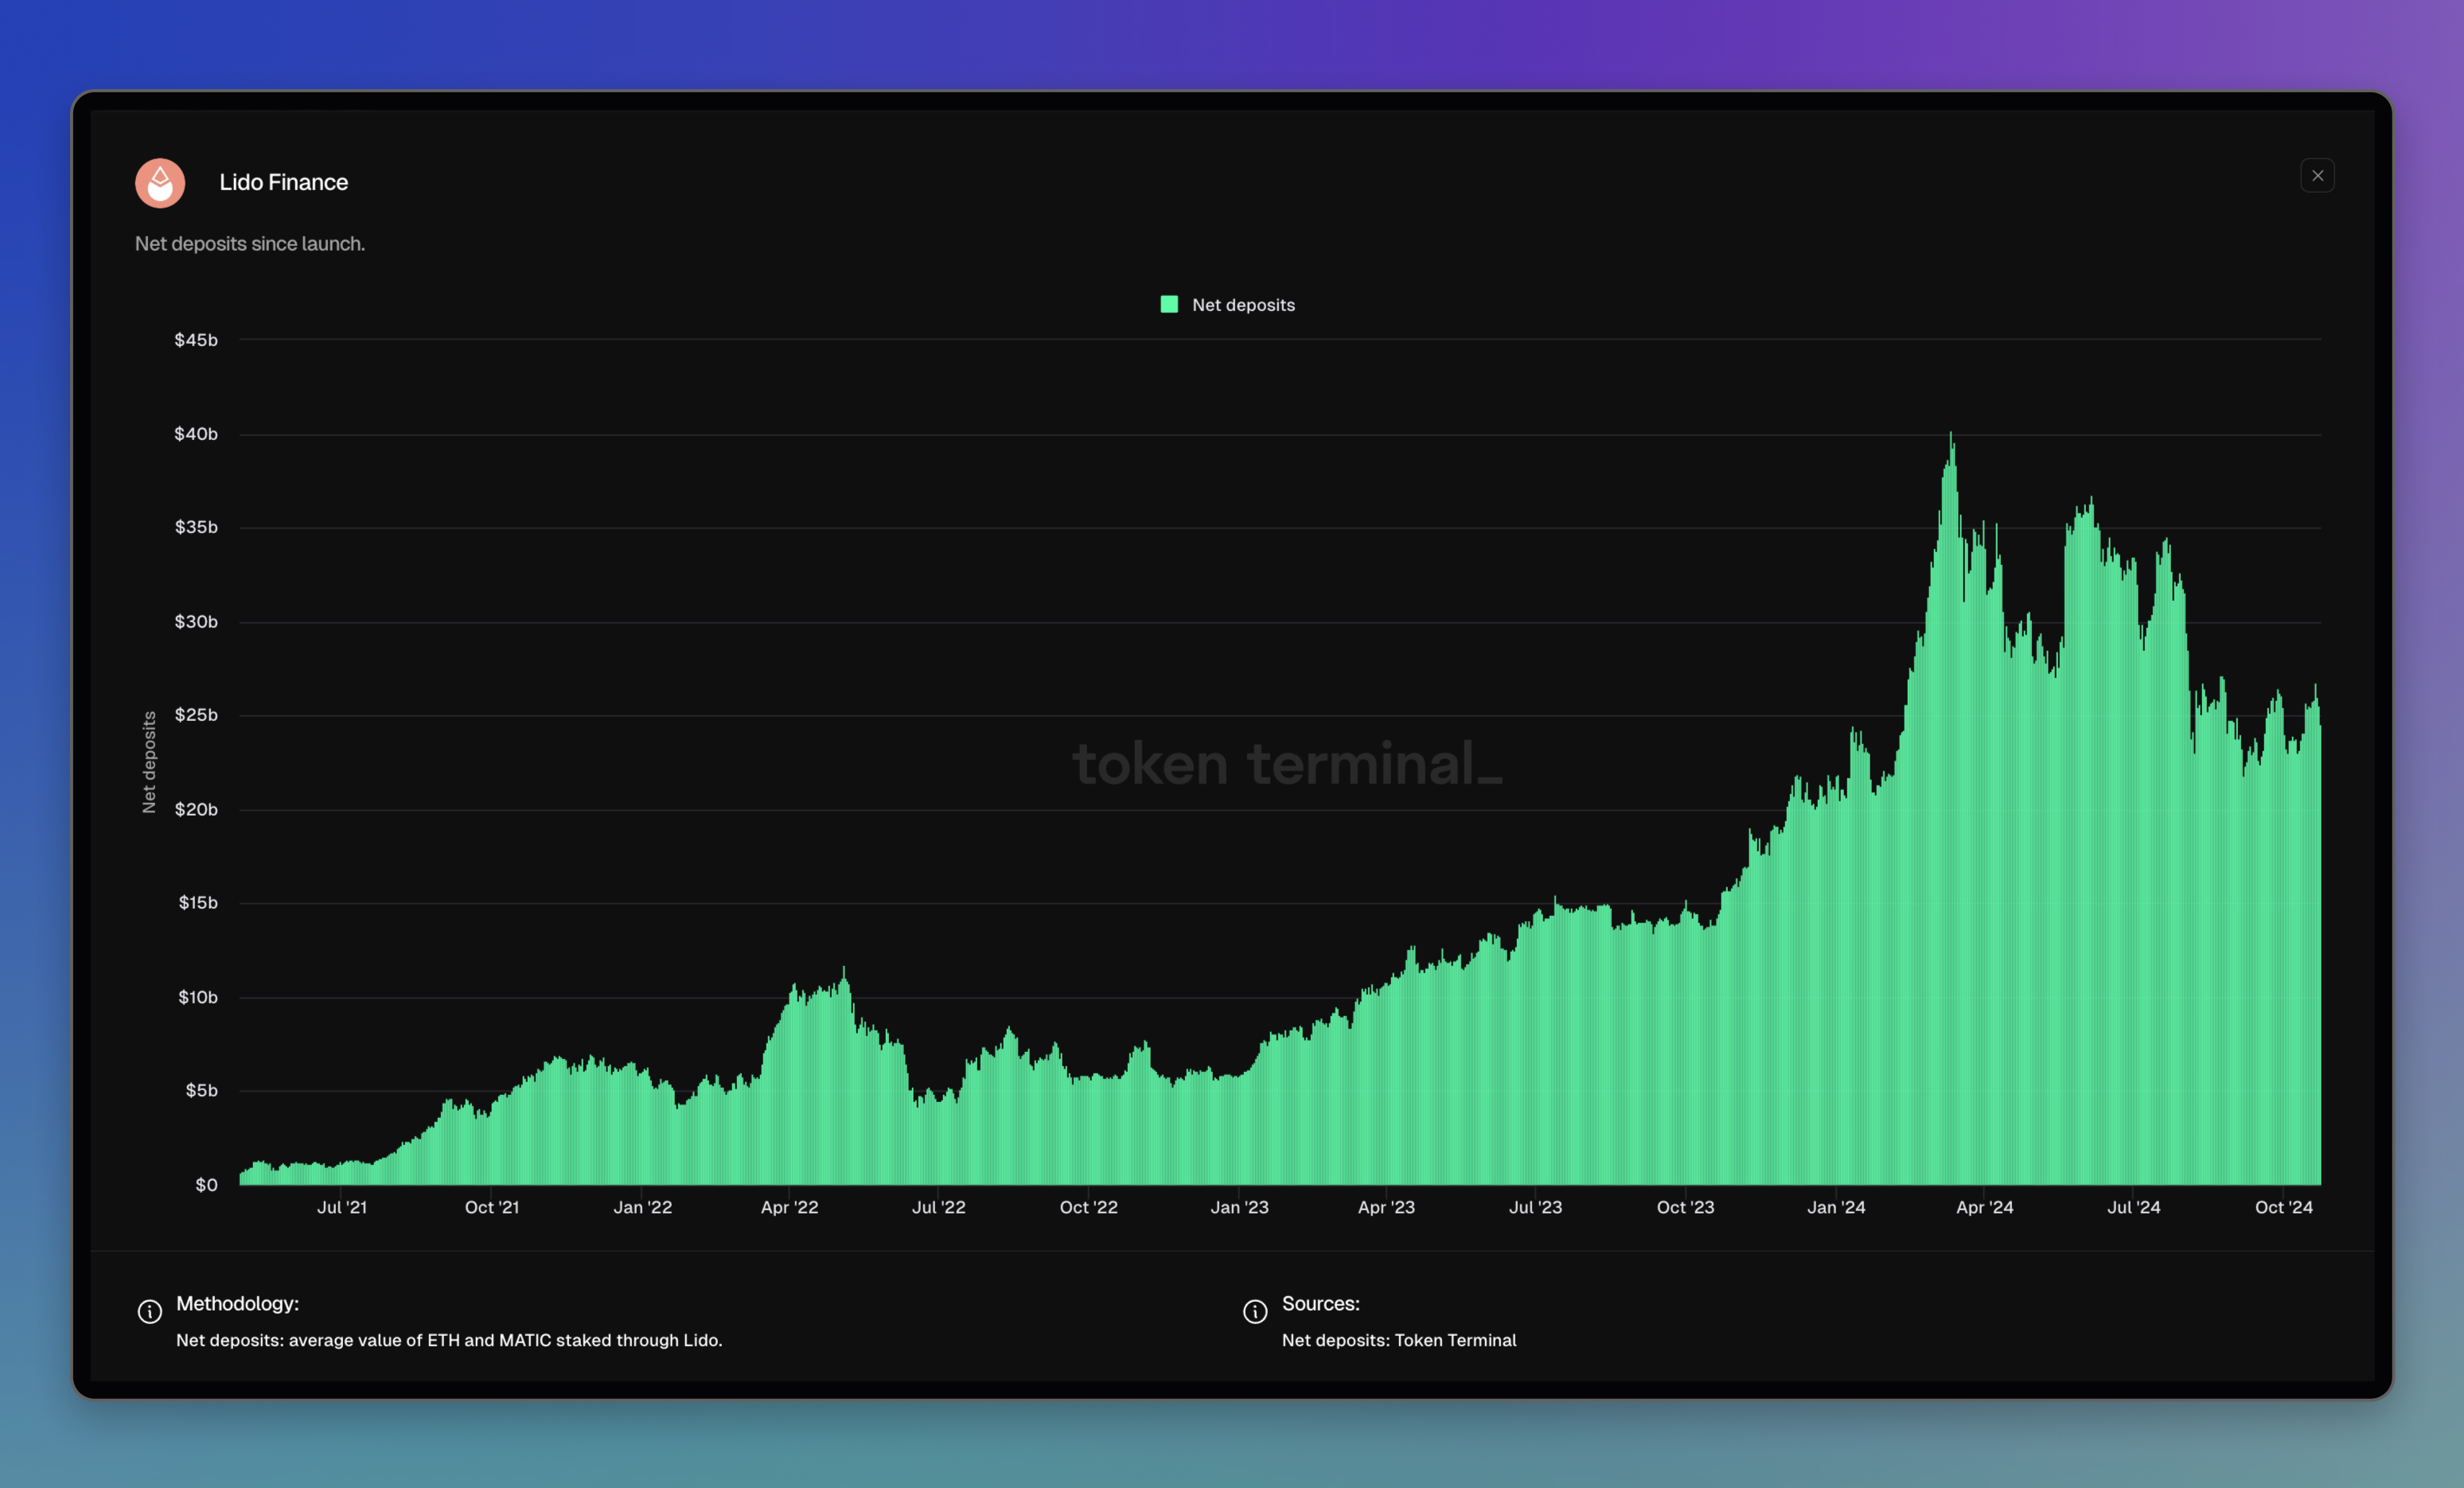
Lido Finance dashboard: https://tokenterminal.com/terminal/projects/lido-finance
Updated 4 months ago